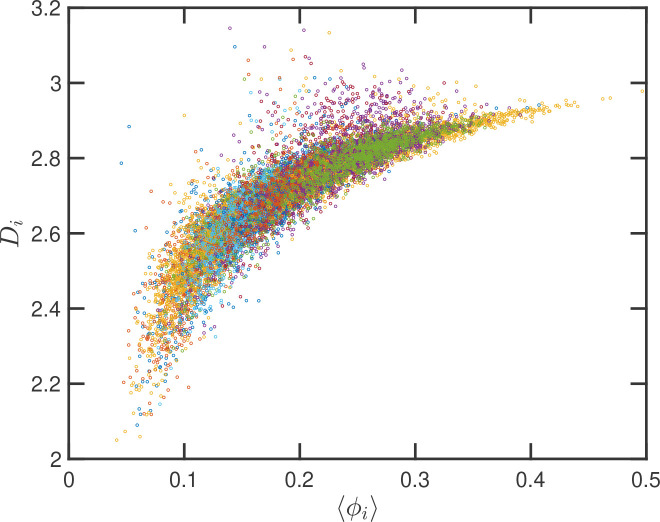
Figure 8: Local correlation between packing parameter and chromatin volume concentration:
Relation between the calculated with the average local volume fraction . Both quantities are calculated for the same configuration and in the same spherical region of 240 nm in radius. The figure includes one point for each one of the 12,000 configurations of the twelve simulated ensembles.

