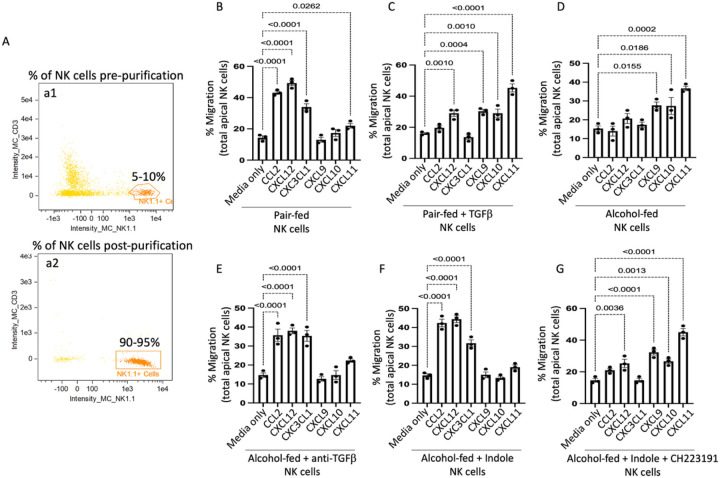
Figure 9. Alcohol dysregulates NK cell migration in response to chemokines.
Mouse primary NK cells were collected from alcohol-fed and treated mice and added to the apical side of a Transwell and migration in response to different chemokines was assessed following 5 hrs of incubation. (A) Confirmation of NK cell purification. (a1) Percentage of NK cells pre isolation, and (a2) percentage of NK cells post isolation. NK-cell migration response profiles to different chemokines from (B) Pair-fed mice, (C) pair-fed mice treated with TGFβ1, (D) alcohol-fed mice, (E) alcohol-fed mice treated with anti-TGFβ1, (F) alcohol-fed mice treated with indole, and (G) alcohol-fed mice treated with indole and CH223191. Percent migration was calculated as the total number of viable NK cells in the bottom well divided by the total number of viable NK cells added to the Transwell insert; p values are indicated in the figure by one-way ANOVA with Sidak’s multiple comparison. N = 3/group (6 mice per group 2 mice per NK pool).

