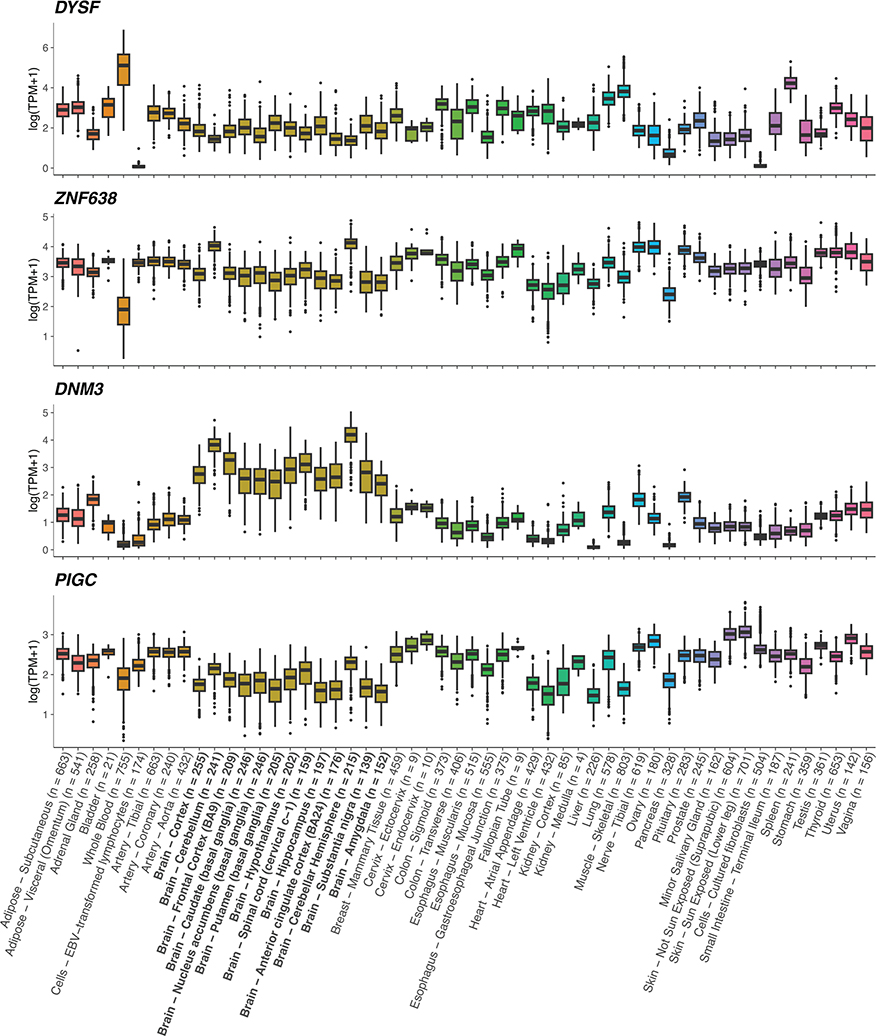
Extended Data Fig. 5 |. Tissue expression for nominated MS severity genes.
Gene expression profiles were obtained from GTEx73 (version 8). Transcripts were collapsed to the gene level and expressed in natural log-transformed transcript per million (TPM) units. DYSF, ZNF638, DNM3 and PIGC are expressed in the brain. Box plots show median, first, and third quartiles; whiskers represent the smallest and largest values within 1.5-times the interquartile range; outliers are depicted as dots. Bold x-axis labels identify CNS tissues. Colors represent tissue types as defined in GTEx.

