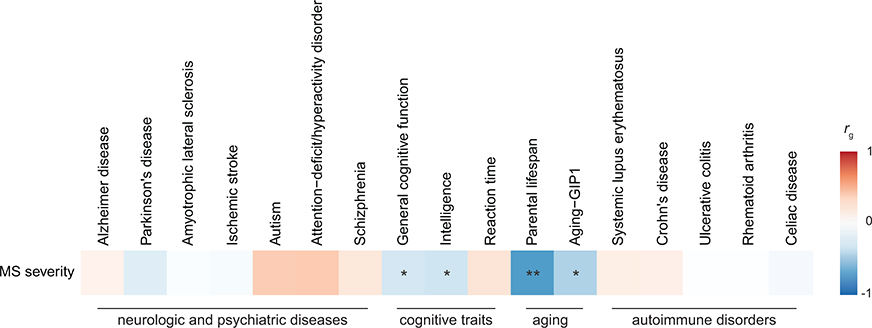
Extended Data Fig. 8 |. Genetic correlations with MS severity.
Shared genetic contribution obtained from cross-trait LDSC. Colors correspond to genetic correlation (rg) estimates (blue, negative; red, positive). An asterisk indicates a correlation that is significantly different from zero, based on two-sided P values calculated using LDSC (*FDR < 0.05, **FDR < 0.01). Full results are in Supplementary Table 17. Aging-GIP1 was constructed using principal component analysis to capture GWASs of healthspan, father lifespan, mother lifespan, longevity, frailty, and self-rated health85.

