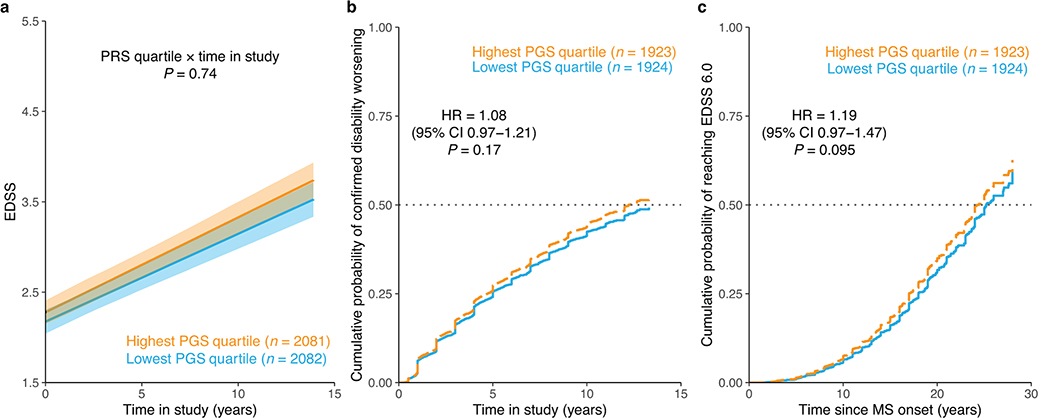
Extended Data Fig. 10 |. MS susceptibility PGS and longitudinal disability outcomes.
a, Adjusted mean EDSS scores over time by PGS quartile predicted from LMM analysis. Shaded ribbons indicate the standard error of the mean over time; P value from LMM. b, Covariate-adjusted cumulative incidence of 24-week confirmed disability worsening comparing individuals in the highest versus those in the lowest quartile of MS susceptibility PGS. c, Covariate-adjusted cumulative incidence of requiring a walking aid for the same groups of individuals. HR and two-sided P values were obtained from Cox proportional hazards models using imputed allele dosage (b–c; Methods). Across all analyses, the MS susceptibility PGS had no influence on longitudinal outcomes.

