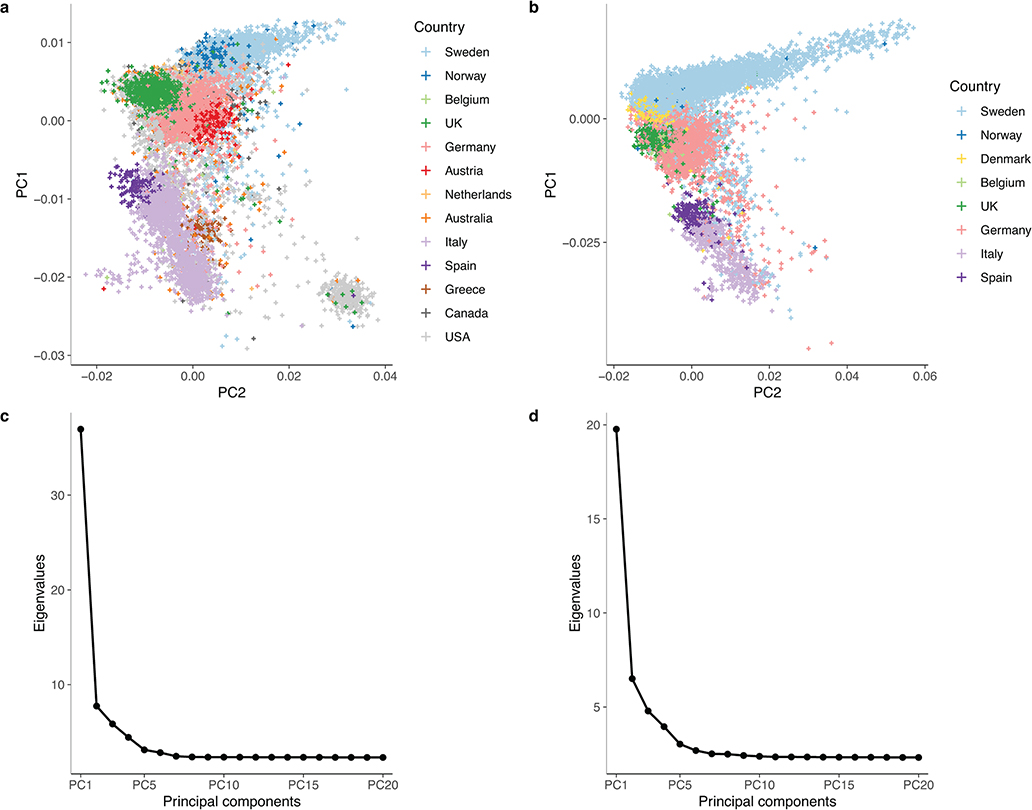
Extended Data Fig. 2 |. Principal component analysis of the discovery and replication populations.
MS cases were recruited from 13 countries for the discovery (a) and 8 for the replication (b). After removing population outliers, all remaining cases were of European ancestry. The first two principal components respectively captured the north-to-south and east-to-west gradients of European genetic structure. US and Canadian participants overlapped with those from other countries. Based on self-reported ancestry, East European and Ashkenazi Jewish individuals constituted the majority of the predominantly US subcluster located at the bottom right of the discovery population (a). The scree plots for our principal component analysis in the discovery (c) and replication (d) populations confirm that the first few principal components capture most of the variance attributable to the minimal population structure remaining after quality control.

