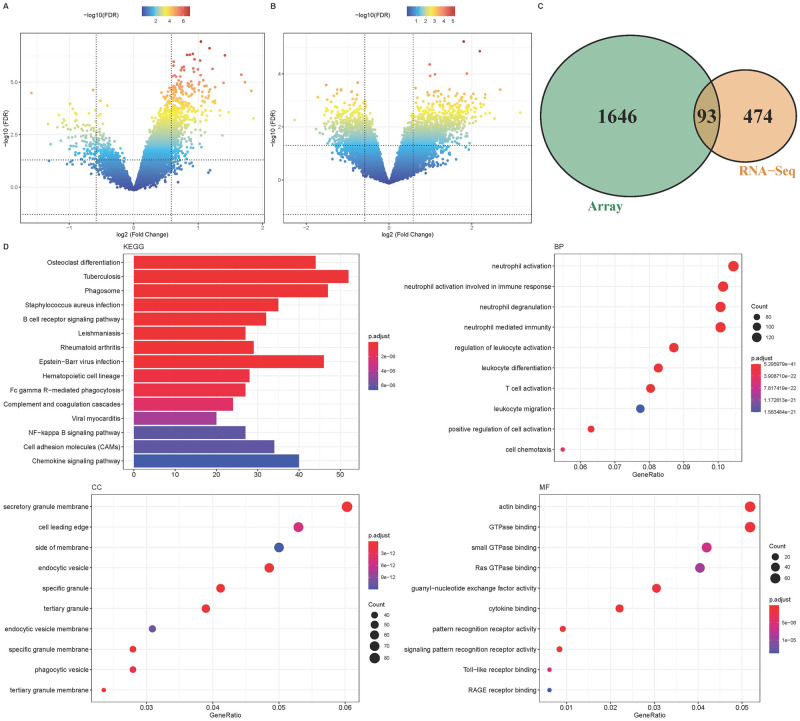
Fig 1. Acquisition and enrichment analysis of DEGs.
A: PCOS data of microarray and DEGs volcano map of control group; B: PCOS data of the RNA-Seq cohort and DEGs volcano map of the control group; C: 93 common differential genes in the two datasets; D: GO and KEGG enrichment analysis of up-regulated genes in all PCOS data.

