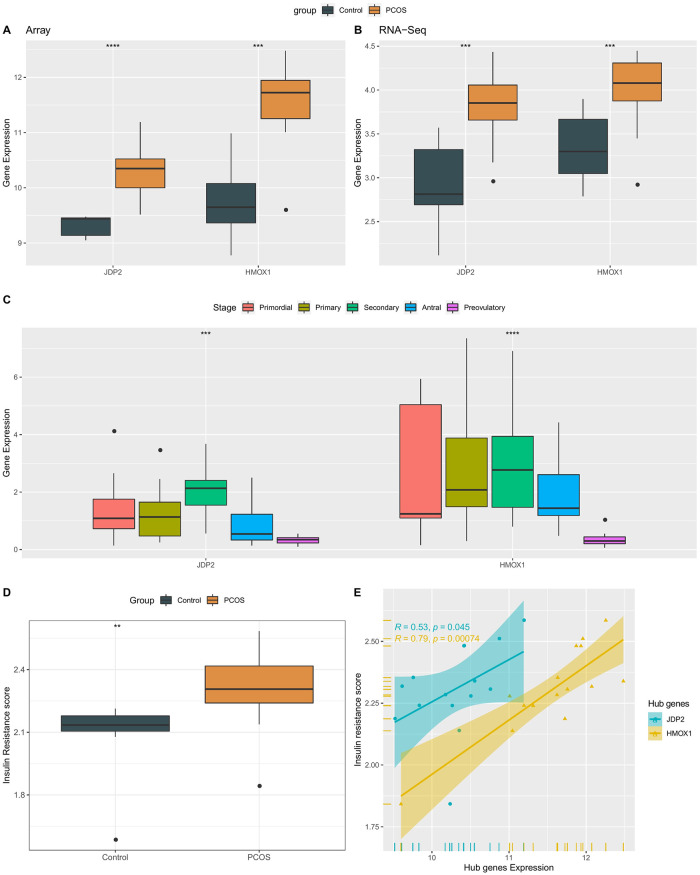
Fig 4. Analysis of expression of two biomarkers.
A: The expression of JDP2 and HMOX1 in the training set; B: The expression of JDP2 and HMOX1 in the test set; C: Expression of JDP2 and HMOX1 in granulosa cells at different follicular development stages; D: The difference of IR score between PCOS and normal control group; E: JDP2 and HMOX1 were correlated with IR scores.

