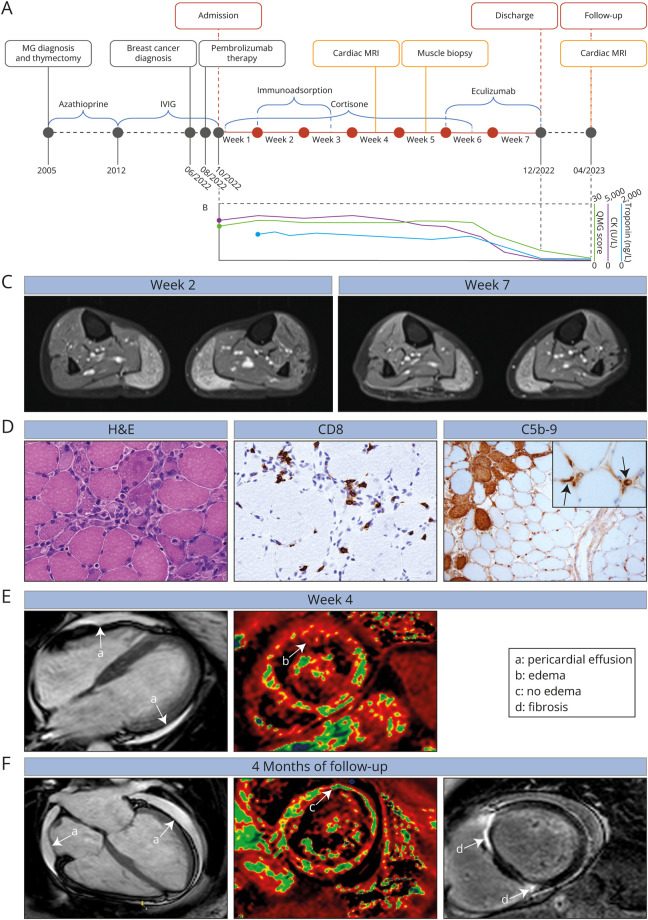
Figure. Clinical Findings and Course of Disease.
(A) Timeline of preceding events, in-hospital stay and follow-up. (B) Quantitative myasthenia gravis (QMG) score, creatine kinase (CK), and troponin levels during the course of disease. (C) MRI of the lower thigh demonstrating myositis of the gastrocnemius muscle on both sides 2 weeks after admission (left) and 7 weeks after admission (right). T2 sequences with contrast are shown. (D) Hematoxylin and eosin (H&E) stain (left) demonstrating necrotizing myopathy with scattered necrotic and regenerating fibers and numerous capillaries with thickened vessel walls. Immunohistochemistry staining for CD8 (middle). Sparse CD8 positive cells are seen in the vicinity of damaged muscle fibers. Immunohistochemistry staining for C5b-9 (right) displaying complement deposition on scattered muscle fibers and capillaries (marked by black arrows in inlet). 20× magnification was used for image acquisition. (E) Cardiac MRI 4 weeks after admission demonstrating pericardial effusion (a) and substantial edema (b) as signs of myocarditis. T2 sequences are shown (left) and quantification of water content (right; water is indicated in red, healthy tissue in green). (F) Follow-up cardiac MRI 4 months after discharge demonstrating no myocarditis (c) but pericardial effusion (a) and signs of cancer therapy–related cardiac dysfunction with myocardial fibrosis (d). T2 sequences are shown (left) and quantification of water content (middle; water is indicated in red, healthy tissue in green). Furthermore, T2 late gadolinium enhancement is depicted (right).

