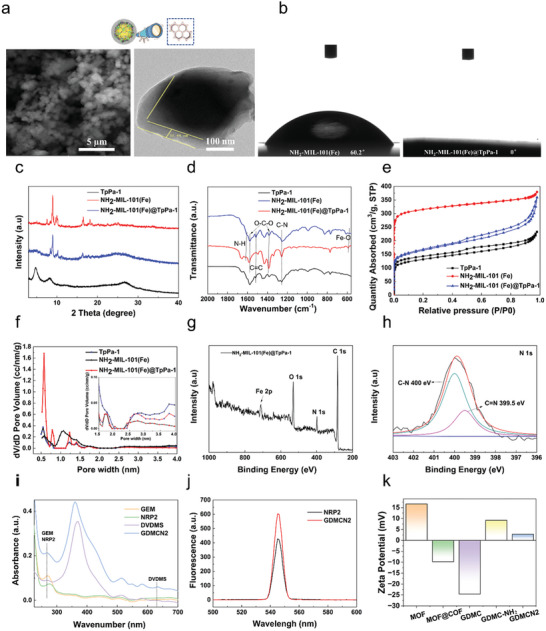
Figure 1.

a) SEM TEM images of GEM‐DVDMS@NH2‐MIL‐101 (Fe)@TpPa‐1. b) The water contact angle of NH2‐MIL‐101(Fe) and NH2‐MIL‐101(Fe)@TpPa‐1 c) XRD patterns of TpPa‐1, NH2‐MIL‐101(Fe) and NH2‐MIL‐101(Fe)@TpPa‐1. d) FT‐IR spectra of TpPa‐1, NH2‐MIL‐101(Fe) and NH2‐MIL‐101(Fe)@TpPa‐1. e) N2 adsorption isotherm and f) pore size distribution of TpPa‐1, NH2‐MIL‐101(Fe) and NH2‐MIL‐101(Fe)@TpPa‐1. g) XPS spectrum over NH2‐MIL‐101 (Fe)@TpPa‐1 of survey and h) high‐resolution XPS spectrum of N 1s. i) UV−vis absorption spectra of GEM, NRP2, DVDMS, and GDCMN2. j) Fluorescence spectra of NRP‐2 and GDCMN2. k) Zeta Potential of MOF, MOF@COF, GDMC, GDMC‐NH2, and GDMCN2.
