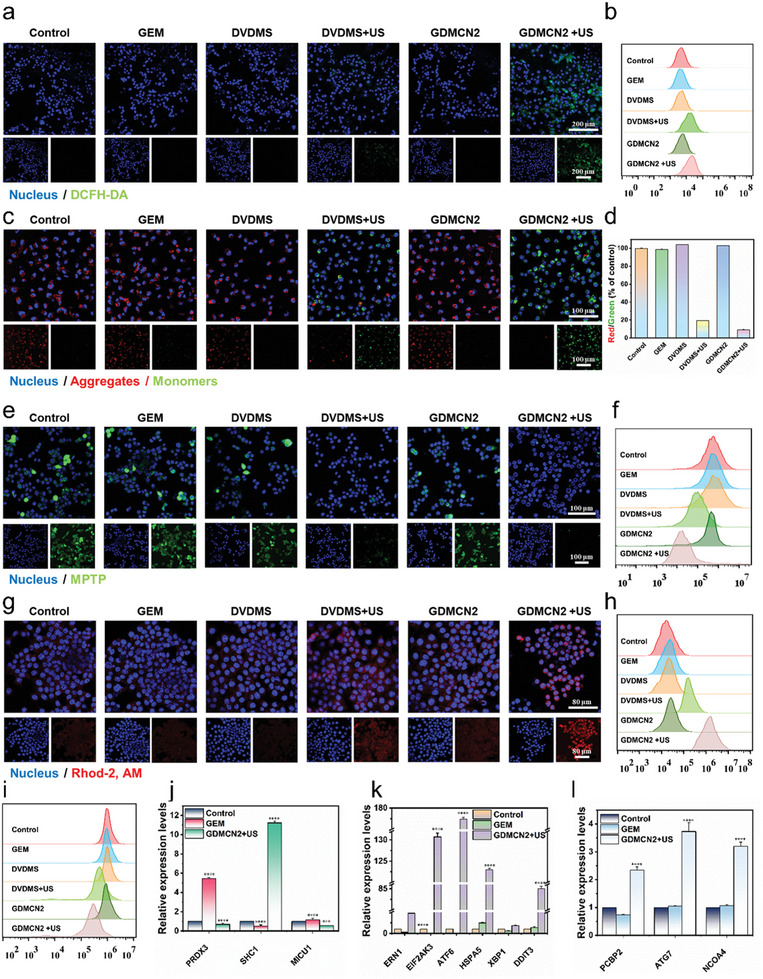
Figure 4.

In vitro oxidative stress and antitumor mechanisms. a and b) Cellular CLSM images and flow cytometric analyses of DCFH‐DA‐stained PANC‐1/GEM cells exposed to different treatments. c and d) JC‐1 stained PANC‐1/GEM cells as seen by CLSM with the appropriate red‐to‐green fluorescence intensity ratio. e,f) PANC‐1/GEM cells stained with MPTP and analyzed using a flow cytometer in a CLSM. g and h) PANC‐1/GEM cells stained with Rhod‐2, AM and examined by a CLSM and a flow cytometer for their responses to different treatments. i) MitoTracker staining of PANC‐1/GEM cells under various conditions and analyzed by flow cytometry. j–l) Intracellular endoplasmic reticulum stress, mitochondrial calcium damage, autophagy‐related RT‐qPCR relative expression level under different treatments.
