
Figure 8.
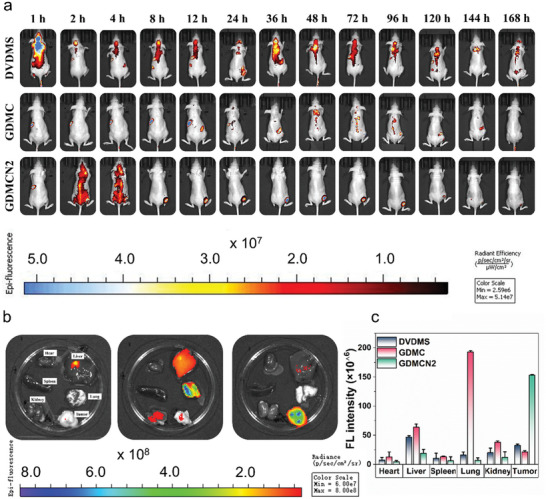
In vivo distributions of GDMCN2 nanocage at different times. a and b) Nude mice with tumors were imaged intravenously with different formulations and were also imaged ex vivo including critical organs. c) Quantitative analysis of ex vivo fluorescence images collected at different time intervals.