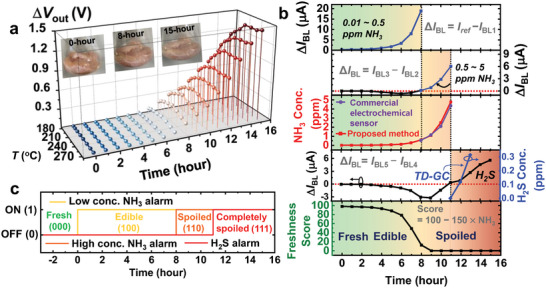
Figure 6.

Meat spoilage tracking using the proposed AOS. a) Transient ΔV outs during the spoilage of chicken tenderloin. The images of the food are shown in the insets. b) ΔI BLs, system‐inferred NH3 gas concentration, commercial electrochemical sensor‐inferred NH3 gas concentration, TD‐GC‐inferred H2S gas concentration, system‐inferred H2S gas generation time, and freshness score during food spoilage. The NH3 gas concentrations in the ranges of 0.01–0.5 ppm and 0.5–5 ppm are inferred using I ref−I BL1 and I BL3−I BL2, respectively. The generation of H2S gas is inferred using the change in the sign of I BL5−I BL4 from negative to positive. The freshness score is calculated using Score = 100−150 × NH3 gas concentration. If the food generates >0.5 ppm of NH3 gas, a freshness score of 0 is assigned. c) Method of classifying the food condition using the three outputs of the AOS as binary signals. The system provides binary signals whether 1) the NH3 gas concentration is >0.01 ppm (low conc. NH3 alarm, yellow line), 2) the NH3 gas concentration is >0.5 ppm (High conc. NH3 alarm, orange line), and 3) H2S gas is generated (H2S alarm, red line). By using three binary signals, the food conditions are labeled fresh (000), edible (100), spoiled (110), and completely spoiled (111).
