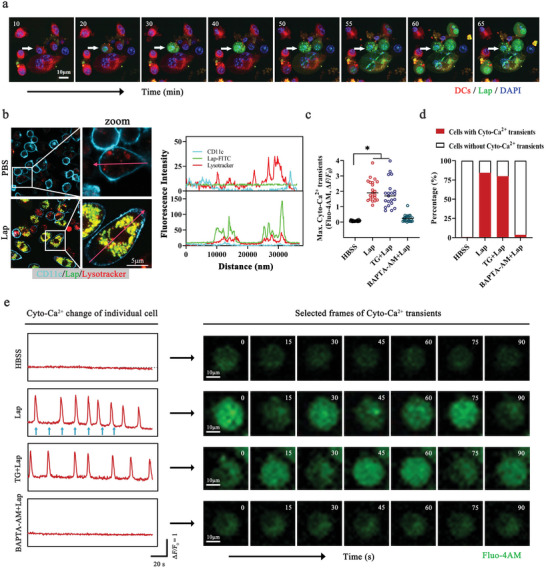
Figure 3.

Lap‐induced calcium flickers in DCs. a) Representative dynamic imaging of live DCs treated with Lap. Red: DCs stained with CellTracker Deep Red Dye; green: FITC‐labeled Lap. The numbers on the graphs indicate the time in minutes. See also Video S1 (Supporting Information). b) Colocalization analysis of Lap location on DCs. Left panel: CLSM images of DCs treated with Lap for 1 h. Turquoise: DC surface marker CD11c; green: FITC‐labeled Lap; red: LysoTracker. Right panel: fluorescence intensity statistics along the cherry arrows. c) DCs Cyto‐Ca2+ transient amplitudes were quantified by measuring the change in maximum fluorescence intensity of Fluo‐4AM; statistics are shown as mean ± SD (n = 21, “n” represents the number of cells observed per experimental group). d) Percentage of DCs exhibiting Cyto‐Ca2+ transients in the Hanks’ Balanced Salt Solution (HBSS) group as well as the Lap‐treated group after inhibitor pretreatment. HBSS group: n = 119; Lap group: n = 153; TG + Lap group: n = 130; BAPTA‐AM + Lap group: n = 141, “n” represents the number of cells observed per experimental group. e) Dynamic monitoring of Cyto‐Ca2+ in DCs. Cells were challenged with Lap ± Thapsigargin (TG, microsomal Ca2+‐ATPase inhibitor, 1 µM) and BAPTA‐AM (Cyto‐Ca2+ chelator, 10 µM). Left panel: Representative tracking of the Cyto‐Ca2+ dynamics of DCs labeled with Fluo‐4AM. Blue arrows: Time points of the displayed Cyto‐Ca2+ transient frames. Right panel: selected frames of Cyto‐Ca2+ transients in DCs. The numbers on the graphs indicate the time in seconds. See also Video [Link], [Link], [Link], [Link] (Supporting Information). *P < 0.05 compared with PBS or HBSS group. Representative results from two or three replicates are shown.
