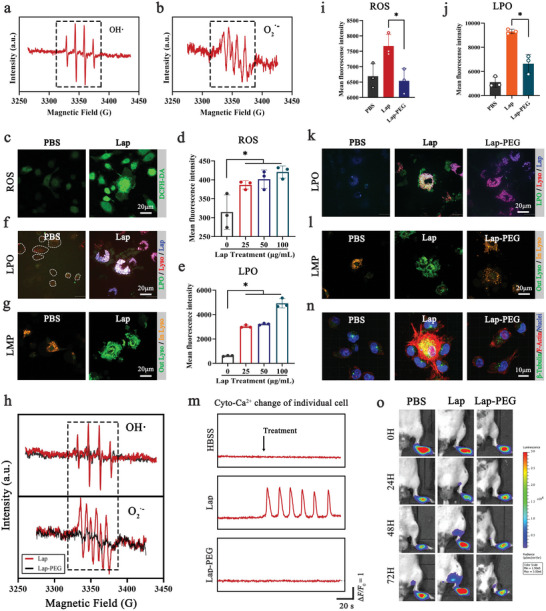
Figure 4.

Lap promoted DC migration via free radical‐induced lysosomal reprogramming. a, b) Electron paramagnetic resonance (EPR) spectra of hydroxyl radicals and superoxide radicals on Lap. c) Reactive oxygen species (ROS) accumulation in DCs after Lap coincubation was detected using the 2′−7′ dichlorofluorescein diacetate (DCFH‐DA) probe. d) FCM analysis of ROS level in DCs after Lap co‐incubation. Data showed as mean ± SD (n = 3, “n” represents three independent replicate samples per experimental group). e) FCM analysis of LPO level in DCs after Lap co‐incubation. Data showed as mean ± SD (n = 3, “n” represents three independent replicate samples per experimental group). f) LPO accumulation in DCs after Lap co‐incubation was detected using the Liperfluo probe. Green: LPO indicator; Red: LysoTracker; Blue: rhodamine‐labeled Lap. g) Detection of DC lysosomal membrane permeability (LMP) after Lap coincubation using acridine orange (AO) staining. Orange: AO is located in the lysosomes. Green: AO escapes from the lysosomal lumen to the cytosol. h) EPR spectra of free radicals on Lap and Lap‐polyethylene glycol (PEG). i) The effect of PEGylation on Lap‐induced ROS elevation was analyzed using FCM. Data represent mean ± SD (n = 3). j) The effect of PEGylation on Lap‐induced LPO accumulation was analyzed by FCM. Data represent mean ± SD (n = 3, “n” represents three independent replicate samples per experimental group). k) CLSM images of the effect of PEGylation on Lap‐induced LPO accumulation. l) CLSM images of PEGylation interference with Lap‐stimulated LMP. m) Dynamic monitoring of Cyto‐Ca2+ transients of Lap‐DCs and Lap‐PEG‐DCs. The percentages of DCs with Ca2+ changes are shown below. n) Cytoskeletal rearrangement of DCs after coincubation with Lap and Lap‐PEG. Red: F‐actin; green: β‐tubulin; blue: nuclei. The mean fluorescence intensity of F‐actin and β‐tubulin was measured and displayed. o) Bioluminescence imaging of DCs homing to lymph nodes after coincubation with Lap and Lap‐PEG (n = 5). *P < 0.05 between the two groups indicated. Representative results from two or three replicates are shown.
