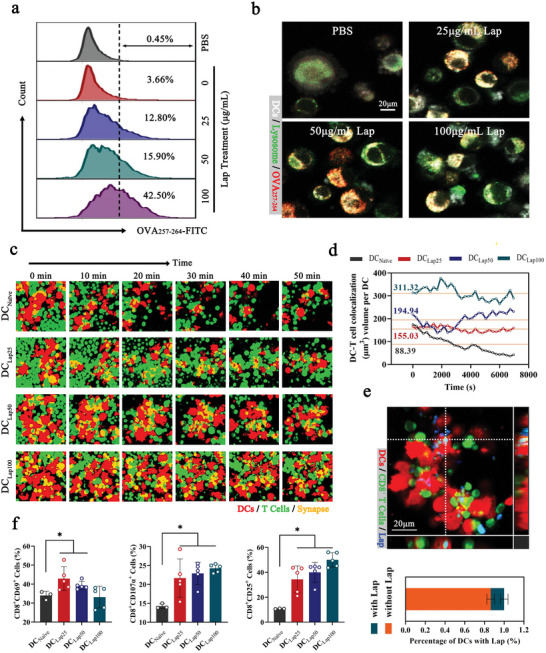
Figure 5.

Lap enhanced the in vitro CD8+ T‐cell priming abilities of DCs. a) FCM analysis of Lap‐DCs coincubated with FITC‐labeled OVAp for 12 h. The representative CLSM images are shown in b). c) Time‐lapse imaging of dynamic interactions between DCs and T cells. Red: DCs expressing tdTomato fluorescent protein; green: CellTracker Deep Red Dye‐labeled CD8+ T cells from OT‐I T‐cell receptor transgenic mice; yellow: DC‐T cell synapses. d) The DC‐T‐cell colocalization volume of DC‐T cells over 120 min. e) Proportion of Lap‐containing DC‐T‐cell synapses. Upper panel: CLSM image of colocalization of Lap, DCs, and T cells. Red: DCs expressing tdTomato fluorescent protein; green: CellTracker Deep Red Dye‐labeled CD8+ T cells from OT‐I T‐cell receptor transgenic mice; blue: FITC‐labeled Lap. Bottom panel: Statistical analysis of the percentage of DCs with Lap. Data represent mean ± SD (n = 8, “n” represents the number of fields observed per experimental group). f) FCM assays for activation of CD8+ T cells coincubated with Lap‐DCs, including CD25, CD69, and CD107a. Data represent mean ± SD (n = 5). *P < 0.05 compared with DCNaïve group. Representative results from two or three replicates are shown.
