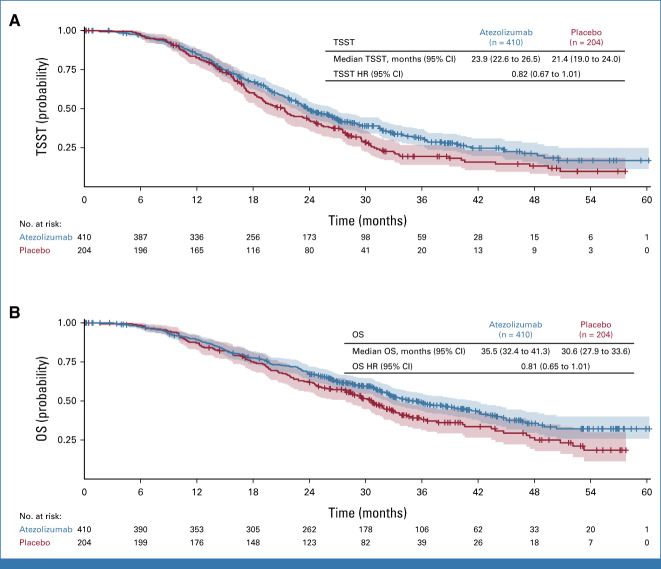
FIG 4.
Secondary end points. (A) Time to second subsequent therapy in the ITT population. (B) OS (interim analysis) in the ITT population. Shaded area for each line represents the 95% CI. HR, hazard ratio; ITT, intention-to-treat; OS, overall survival; TSST, time from random assignment to start of second subsequent therapy or death.

