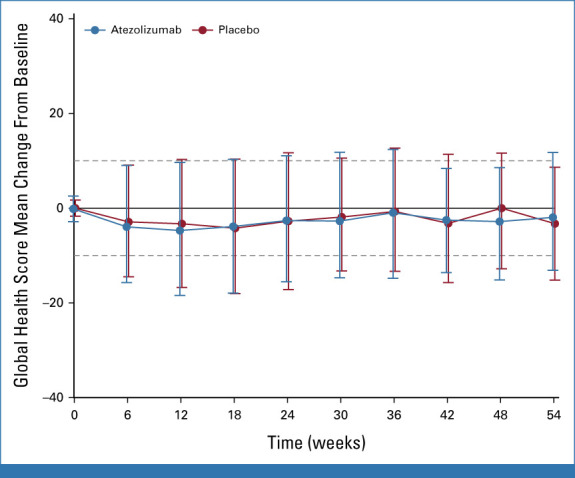
FIG A2.

Mean change from baseline in HRQoL. Dashed lines represent the 10% threshold considered to be a clinically relevant change. Error bars represent 95% CIs. HRQoL was scored according to EORTC guidelines, described by mean and standard deviations, and compared between treatment arm using a linear mixed model. EORTC, European Organisation for Research and Treatment of Cancer; HRQoL, health-related quality of life.
