Figure 2.

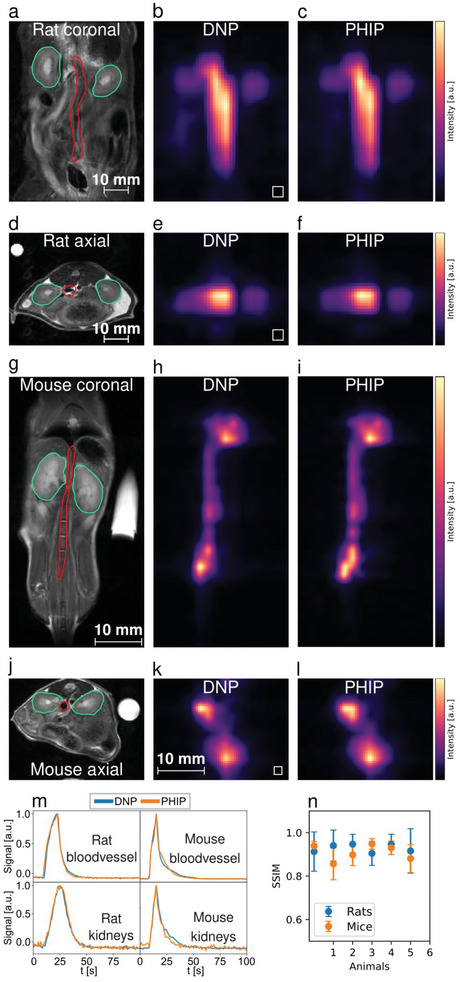
Comparison of perfusion between PHIP and d‐DNP hyperpolarized [1‐13C]pyruvate using a single metabolite targeted spectrally‐selective bSSFP sequence. a–f), datasets from a healthy rat where a) and d) are the anatomical reference images with the segmented regions, namely the kidneys (green) and a central blood vessel (red), b) and c) show interpolated bSSFP maximum intensity projections (MIPs) in horizontal orientation with the original resolution shown as white boxes on the lower left, e) and f) shows MIPs in axial orientation. g–l), pyruvate perfusion MIPs and their anatomical references from a healthy mouse. Visible are a central blood vessel and the heart. The signal intensities b,c,e,f,h,i,m,k,l) were scaled to maximum value for better comparability. m), signal intensity time curves from blood vessels (red ROIs) and kidneys (green ROIs), n), structural similarity indices (SSIM) showing a similar SSIM for rat (0.95 ± 0.03) and mouse (0.88 ± 0.05) measurements.
