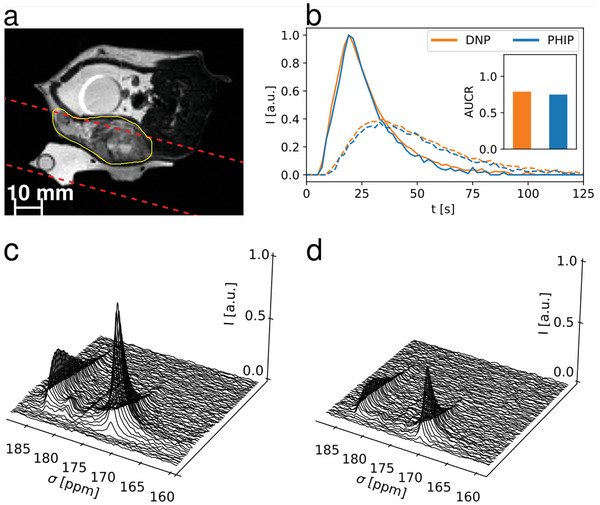
Figure 4.

Comparison of slice‐selective spectroscopy between PHIP and d‐DNP. a), Anatomical image with slice position (red dashed) and tumor (yellow) highlighted. b) pyruvate and lactate signal time‐curves for d‐DNP and PHIP injections in a subcutaneous Mat B III rat tumor model, with area‐under‐the‐curve‐ratio (AUCR) values in the insert (d‐DNP = 0.79, PHIP = 0.75). Time curves were normalized and shifted to align their respective pyruvate peaks to facilitate direct comparison of peak shapes. Spectra shown in c) and d) had 15 Hz line broadening applied and are normalized to the largest pyruvate peak in the d‐DNP spectrum (c), showing a higher signal for the d‐DNP injection in (c), which can be explained due to a higher polarization level of the d‐DNP polarizer configuration.
