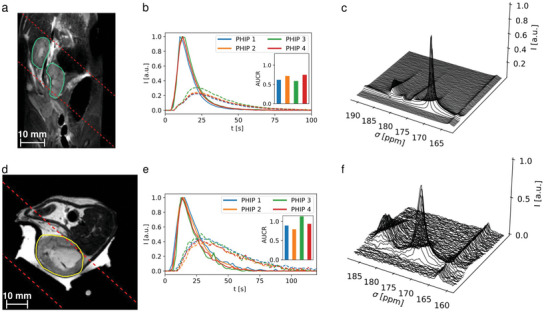
Figure 5.

Slice‐selective spectroscopy of fast, repeated injections of PHIP polarized [1‐13C]pyruvate into a healthy rat a–c) and a Mat B III rat tumor model d–f). a,d) show the anatomical images with the slice position (dashed red), the kidneys (green) and the tumor (yellow) highlighted. b,e) show signal time‐curves of pyruvate and lactate, as well as the area‐under‐the‐curve ratios (AUCR) of the repeated injections as inlets, showing higher AUCR in the tumor (e, 1.06 ± 0.14) compared to a healthy kidney (b, 0.64 ± 0.05). The time curves were normalized and shifted to align their respective pyruvate peaks to facilitate direct comparison of peak shapes. c,f) show time resolved, 15 Hz line‐broadened spectra of the metabolic conversion in the tumor and kidney. A 13C‐urea phantom (peak at 163.5 ppm in c, f) was used for RF power calibration.
