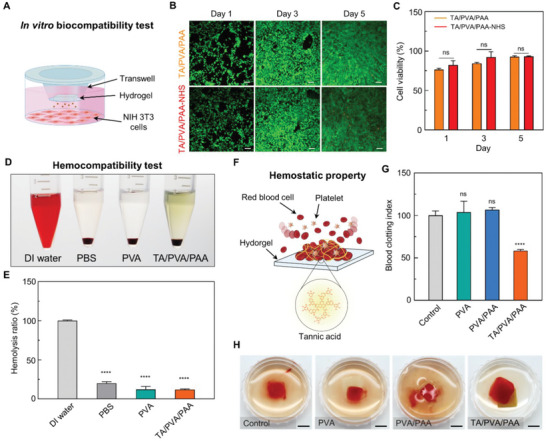
Figure 4.

Biocompatibility and hemostatic effects of the hydrogel. A) Schematic illustration describing the in vitro biocompatibility test. B) Fluorescence microscopy images of live/dead stainings (green: live, red: dead) on NIH 3T3 cells cultured with hydrogels (scale bars, 200 µm). C) Cell viability calculated from the live/dead assay (n = 3: n is the sample size for each group). D) Optical image of hemolysis test on hydrogels (n = 4: n is the sample size for each group). E) Hemolysis ratio of each group. F) Schematic illustration describing the hemostatic effects of the hydrogel. G) Blood clotting index value for each group (n = 4: n is the sample size for each group). H) Photographs of blood clotting on each hydrogel (scale bars, 5 mm). Statistical analyses were conducted with an unpaired t‐test (* p < 0.05, ** p < 0.01, *** p < 0.001, and **** p < 0.0001; ns: no significant difference).
