
Figure 2.
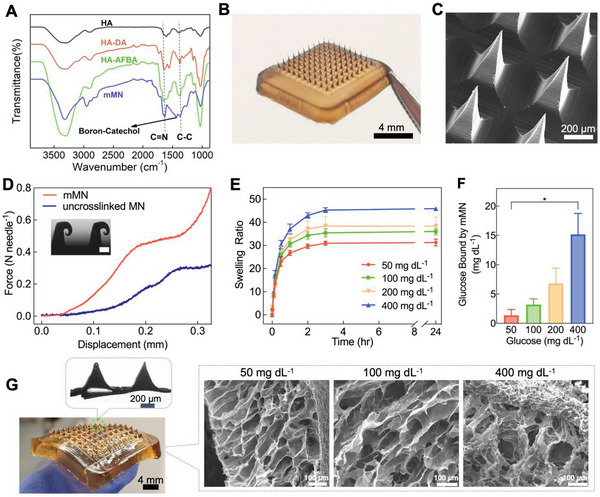
In vitro characterization and glucose‐dependent swelling studies. A) FTIR spectra of HA, HA‐DA, HA‐AFBA, and mMN. B) A photograph of the mMN patch, dimensions of the array: 8 × 8 mm. C) SEM image of the mMN tips. D) Mechanical strength of the mMN patch versus uncrosslinked MN patch; inset: microscopic image of compressed mMN tips (scale bar: 100 µm). E) Swelling ratio of the mMN in pH 7.4 PBS containing various glucose concentrations at 34 °C (n = 3). F) Glucose‐binding capability of the glucose‐responsive mMN in PBS at various glucose concentrations (n = 3). Statistical significance was calculated using a two‐tailed Student's t‐test. * p < 0.01. G) Photograph of the swollen mMN (Top inset: bright‐field micrograph of mMN tips after reaching maximum swelling. Right inset: SEM images of mMN swelled at different glucose concentrations. Data are presented as mean ± standard deviation (SD).