
Figure 4.
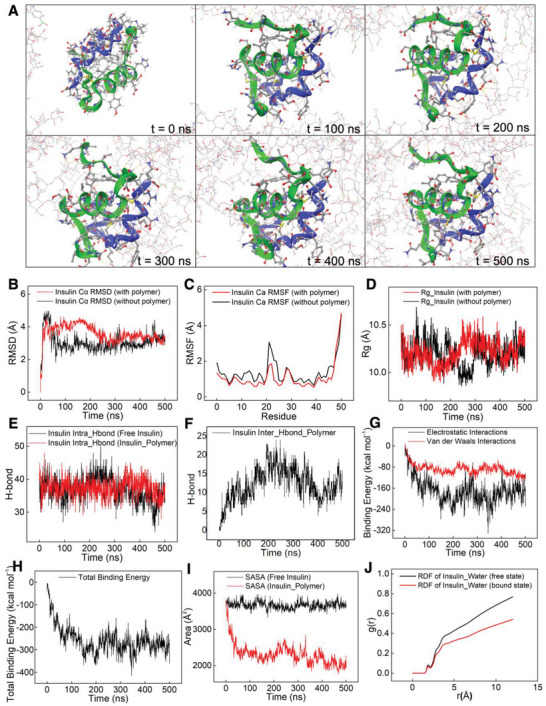
A) Snapshots of the insulin/polymer system at various times, t, during the 500 ns MD simulation. Insulin secondary structure is depicted in blue/green ribbons. B–J) Results extracted from MD simulations of insulin in the absence and presence of the polymer. B) Insulin root‐mean‐square deviation. C) Insulin root‐mean‐square fluctuation. D) Insulin radius of gyration in the absence and presence of the polymer. E) Intra‐H‐bonds in insulin in the absence and presence of the polymer. F) Intermolecular H‐bonds between insulin and the polymer. G) Electrostatic and Van der Waals binding energy between insulin and the polymer. H) Total binding energy between insulin and the polymer. I) The solvent accessible surface area of insulin in the absence and presence of the polymer. J) Radial distribution function of water molecules around free insulin and polymer‐bound insulin. The distance r (Å) is the distance between insulin and the first layer of surrounding water molecules.