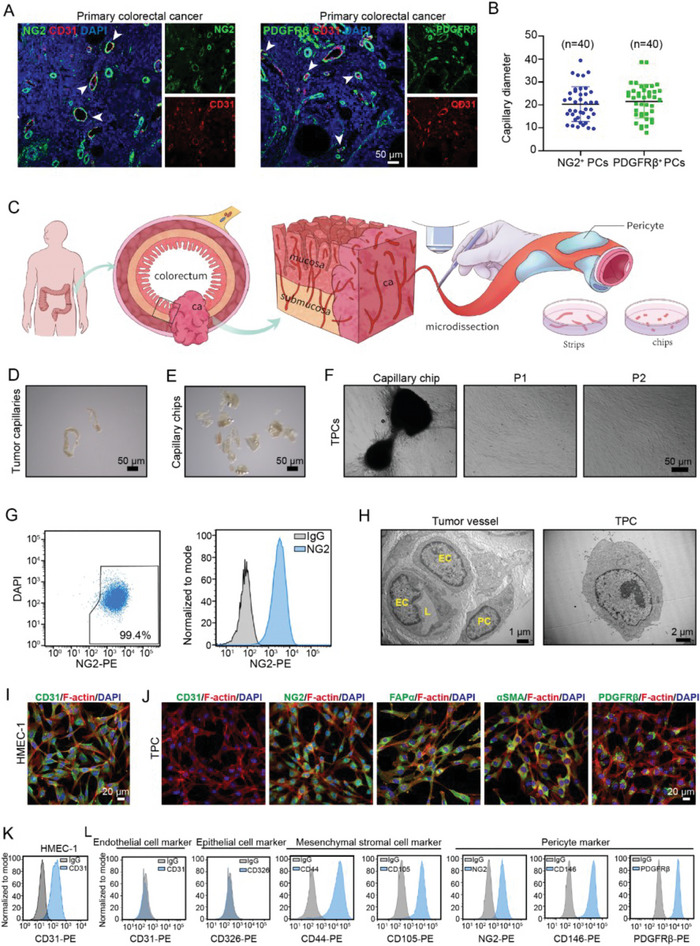
Figure 1.

Isolation and validation of TPCs. A) Immunofluorescence staining for PC markers including NG2 or PDGFRβ (green) in tumor blood vessels (CD31, red) with various diameters (n = 40). The white arrowhead indicates the PCs‐containing capillaries. Scale bar, 50 µm. B) Plot diagram of the diameters in PCs‐containing capillaries (n = 40). Data are presented as mean ± SEM. C) Diagram depicting the isolation of tumor blood vessels from CRC patients. D) Representative images of blood vessels dissected from tumor tissues under the stereomicroscope (n = 6). Scale bar, 50 µm. E) Representative images for the capillary chips (n = 6). Scale bar, 50 µm. F) Representative images for TPC migration and expansion from the cultured capillary chips (n = 6). Scale bar, 50 µm. G) Flow cytometry analysis of NG2 expression in TPCs at passage 2 (n = 6). H) Representative TEM images of the tumor vessels and TPCs (n = 6). Scale bar, 1 µm (left); 2 µm (right). I) Immunofluorescence analysis of CD31 expression in HMEC‐1 cells. Phalloidin‐rhodamine was used to identify F‐actin. Scale bar, 20 µm. J) Immunofluorescence analysis of indicated markers in TPCs (n = 6). Phalloidin‐rhodamine was used to identify F‐actin. Scale bar, 20 µm. K) Flow cytometry analysis of CD31 in HMEC‐1 cells (n = 6). L) Flow cytometry analysis for the expression of endothelial cells, epithelial cells, mesenchymal stromal cells, and pericyte markers in cultured TPCs (n = 6).
