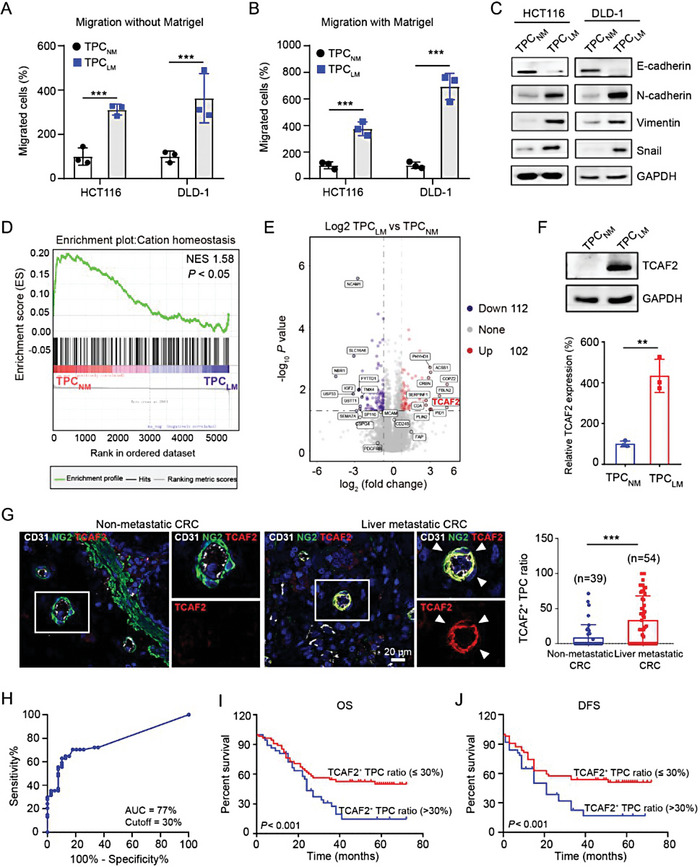
Figure 2.

TCAF2 is highly expressed in TPCs and associated with CRCLM. A,B) Transwell assay for the migration without (A) or with (B) Matrigel of CRC cells primed with the conditioned medium from TPCNM and TPCLM, respectively (n = 3). Scale bar, 100 µm. C) Western blot analysis of E‐cadherin, N‐cadherin, Vimentin, and Snail in HCT116 and DLD‐1 cells primed with conditioned medium from TPCNM and TPCLM, respectively. D) GSEA plots displaying the gene set of cation homeostasis were negatively enriched in TPCLM. E) The volcanic plot of proteins with upregulated (red) and downregulated (purple) expression in TPCNM and TPCLM (log2 (fold change) > 1.5, p‐value < 0.05; n = 3). F) Western blot analysis of TCAF2 in TPCNM and TPCLM (n = 3). G) Representative immunofluorescence images of TCAF2 (red), NG2 (green), and CD31 (grey) in primary tumor sections derived from CRC patients. The white arrowhead indicates the TCAF2 expression in TPCs. Scale bar, 20 µm. Quantification of TCAF2+ TPC ratio is shown. H) ROC curve analysis for the TCAF2+ TPC ratio in CRCLM (n = 93). I) Kaplan–Meier OS curves for patients with a high or low ratio of TCAF2+ TPCs (based on the 30% cutoff, n = 93). J) DFS curves for patients with a high or low ratio of TCAF2+ TPCs (based on the 30% cutoff, n = 93). Data are presented as mean ± SEM. **p < 0.01, ***p < 0.001 by two‐tailed unpaired t‐test in (A,B,F); by Mann–Whitney U test in G; p < 0.001 versus indicated groups by Log‐rank (Mantel–Cox) test in (I,J).
