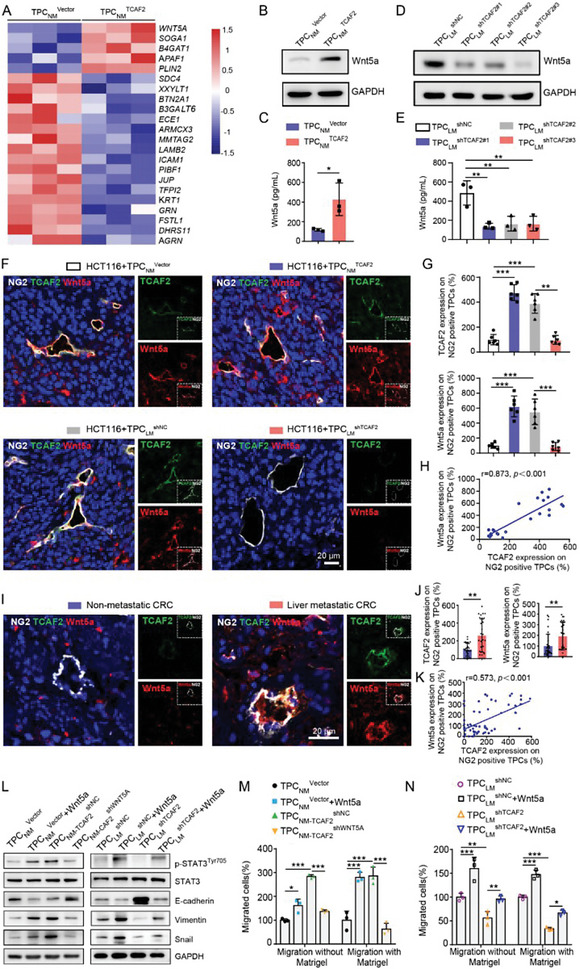
Figure 4.

TCAF2+ TPCs promote tumor cell motility and EMT via the Wnt5a/STAT3 axis. A) Heatmap of the top 22 cytokines in TPCNM Vector and TPCNM TCAF2 identified by proteomics (log2 (fold change) > 1.5, p‐value < 0.05; n = 3). B) Western blot analysis of Wnt5a in TCAF2‐overexpressing TPCs (n = 3). C) ELISA assay for Wnt5a secretion in the culture medium of TCAF2‐overexpressing TPCs (n = 3). D) Western blot analysis of Wnt5a in TCAF2‐knockdown TPCs (n = 3). E) ELISA assay for Wnt5a secretion in the culture medium of TCAF2‐knockdown TPCs (n = 3). F) Immunofluorescence analysis for the colocalization of TCAF2 (green) and Wnt5a (red) in TPC (NG2, gray) in tumor sections derived from CRCLM xenografts (n = 6). Scale bar, 20 µm. G) Quantification of TCAF2 and Wnt5a expression in NG2+ TPCs. H) Pearson's correlation analysis for Wnt5a and TCAF2 expression in NG2+ TPCs. p < 0.001. I) Immunofluorescence analysis showing the colocalization of Wnt5a (red) and TCAF2 (green) in TPCs (NG2, gray) in primary tumor sections derived from CRC patients with or without liver metastasis (n = 30). Scale bar, 20 µm. J) Quantification of TCAF2 and Wnt5a expression in NG2+ TPCs. K) Pearson's correlation analysis for Wnt5a and TCAF2 expression in NG2+ TPCs. p < 0.001. L) Western blot analysis of p‐STAT3Tyr705, STAT3, and EMT markers in HCT116 cells primed with the conditioned medium from TPCNM Vector, TPCNM Vector+Wnt5a (500 ng mL−1), TPCNM‐TCAF2 shNC, TPCNM‐TCAF2 shWNT5A, TPCLM shNC, TPCLM shNC+Wnt5a (500 ng mL−1), TPCLM shTCAF2, or TPCLM shTCAF2+Wnt5a (500 ng mL−1). M,N) Transwell assay for the migration (with or without Matrigel) of HCT116 cells primed with the conditional medium from the indicated TPCs (n = 3). Data are presented as mean ± SEM. *p < 0.05, **p < 0.01, and ***p < 0.001 by two‐tailed unpaired t‐test in (C); by Mann–Whitney U test in (J); by one‐way ANOVA followed by Tukey's post hoc test in (E,G,M,N).
