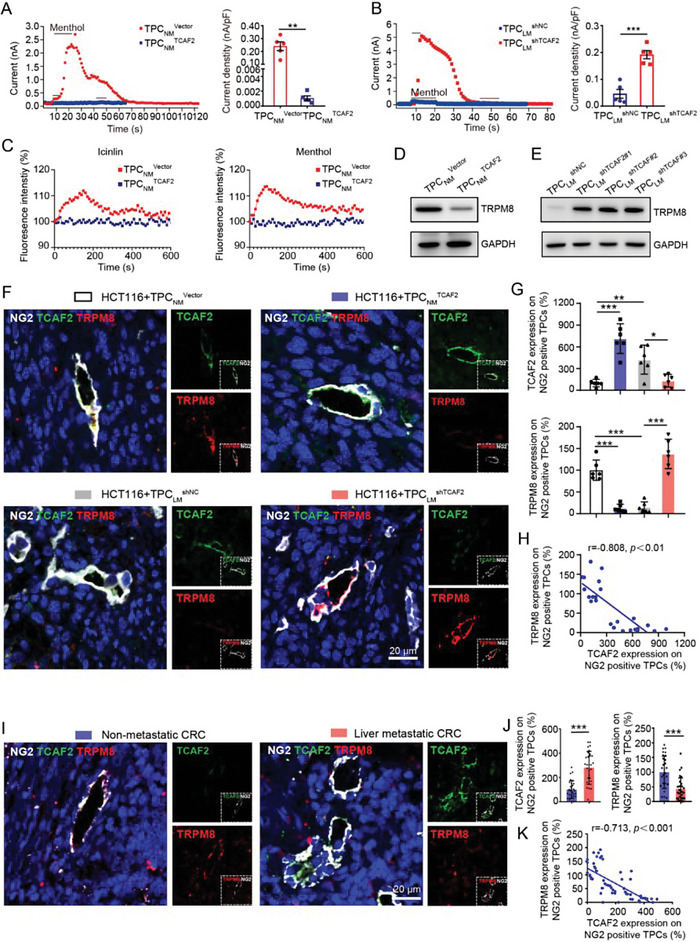
Figure 5.

TCAF2 inhibits the expression and ion channel activity of TRPM8 in TPCs. A,B) Mean time course of menthol‐activated ITRPM8 in TCAF2‐overexpressing or ‐knockdown TPCs (n = 3). Quantification of the maximal value of ITRPM8 is shown. C) Intracellular Ca2+ change in response to menthol (500 µm) or icilin (100 µm) treatment of TPCs (n = 3). D,E) Western blot analysis of TRPM8 in TCAF2‐overexpressing (D) or ‐knockdown (E) TPCs. F) Immunofluorescence staining of TCAF2 (green) and TRPM8 (red) expression in TPCs (NG2, gray) in primary tumor sections derived from CRCLM xenografts (n = 6). Scale bar, 20 µm. G) Quantification of TCAF2 and TRPM8 expression in NG2+ TPCs. H) Pearson's correlation analysis for TRPM8 and TCAF2 in NG2+ TPCs. I) Representative images of TCAF2 (green) and TRPM8 (red) colocalization in TPCs (NG2, gray) in primary tumor sections derived from CRC patients with or without liver metastasis (n = 30). Scale bar, 20 µm. J) Quantification of TCAF2 and TRPM8 expression in NG2+ TPCs. K) Pearson's correlation analysis for TRPM8 and TCAF2 in NG2+ TPCs. Data are presented as mean ± SEM. *p < 0.05, **p < 0.01, ***p < 0.001 by two‐tailed unpaired t‐test in (A,B); by one‐way ANOVA followed by Tukey's post hoc test in (G); by Mann–Whitney U test in (J).
