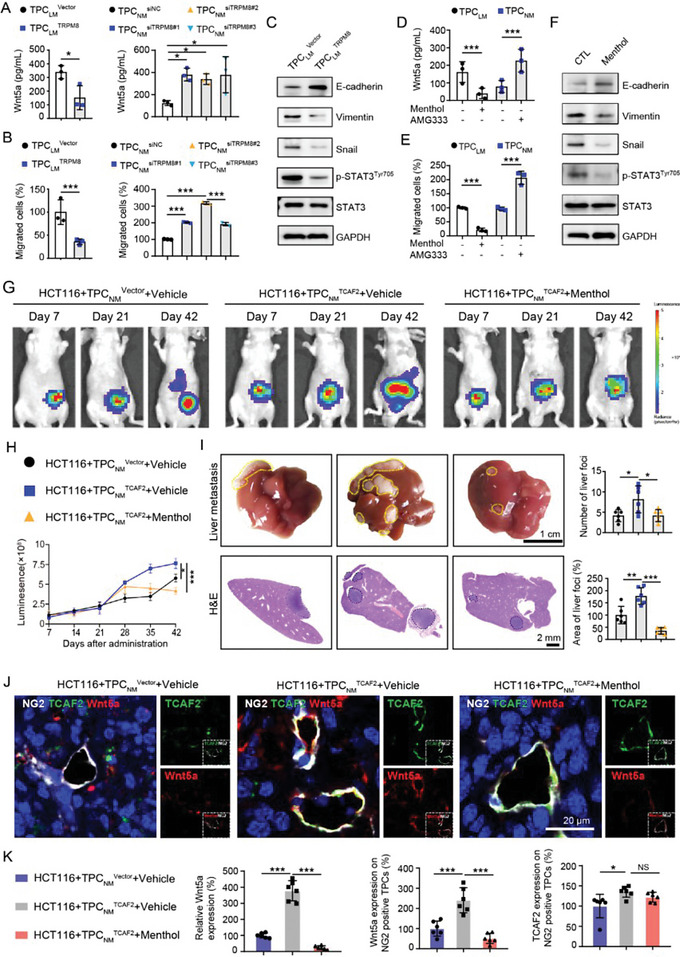
Figure 6.

Activation of TRPM8 in TPCs suppresses Wnt5a secretion and CRCLM. A) ELISA analysis of Wnt5a secretion in the culture medium of TRPM8‐overexpressing or ‐knockdown TPCs (n = 3). B) Transwell assay for the migration of HCT116 cells primed with the conditioned medium from TRPM8‐overexpressing or ‐knockdown TPCs (n = 3). C) Western blot analysis for p‐STAT3Tyr705, STAT3, and EMT markers in HCT116 cells primed with the conditioned medium of TRPM8‐overexpressing TPCLM. D) ELISA assay for Wnt5a secretion in the culture medium of TPCs treated with menthol (100 µm) or AMG333 (40 µm) (n = 3). E) Transwell assay for the migration of HCT116 cells primed with the conditioned medium from TPCs pre‐treated with or without menthol (100 µm) or AMG333 (40 µm) (n = 3). F) Western blot analysis for EMT markers, STAT3, and p‐STAT3Tyr705 in HCT116 cells primed with the conditioned medium from TPCs pre‐treated with menthol (100 µm). G,H) Representative images and quantification of bioluminescence signals in primary tumor sections (n = 6). HCT116 cells were co‐injected with either TPCNM Vector or TPCNM TCAF2 into the cecum wall of nude mice. Three weeks later (Day 21), mice injected with HCT116 cells and TPCNM TCAF2 were randomly divided into vehicle and menthol (80 mg kg−1, ip) groups. I) Representative images and quantification of liver metastases derived from CRCLM xenografts treated with or without menthol (n = 6). Yellow and black dotted lines indicate the liver metastatic foci. Scale bar, 1 cm (up); 2 mm (down). J) Immunofluorescence analysis for the colocalization of TCAF2 (green) and Wnt5a (red) in TPCs (NG2, gray) in primary tumor sections derived from CRCLM xenografts treated with or without menthol (n = 6). Scale bar, 20 µm. (K) Quantification for TCAF2 and Wnt5a expression in NG2+ TPCs and tumors. Data are presented as mean ± SEM. NS, *p < 0.05, **p < 0.01, ***p < 0.001 by two‐tailed unpaired t‐test in (A) (left), (B) (left), (D,E); by one‐way ANOVA followed by Tukey's post hoc test in (A) (right), (B) (right), (H,K).
