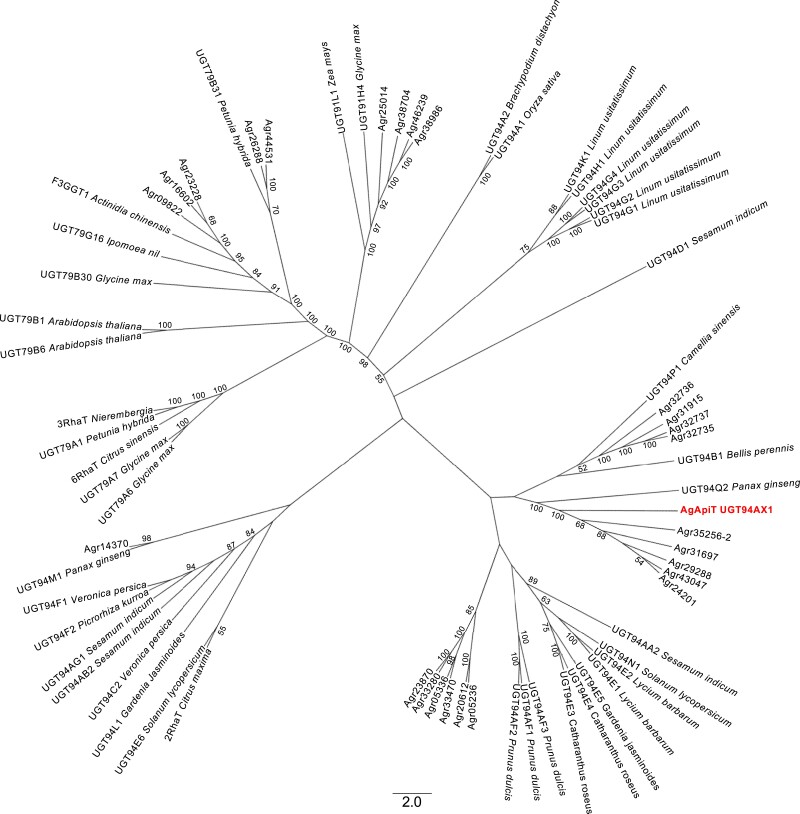
Figure 1.
Phylogenetic tree of GGTs including AgApiT. The sequences were obtained from UGT Nomenclature Committee Website and CeleryDB (Li et al. 2020). Twenty-six celery GGTs are shown in AGR. AgApiT was shown in bold. Numbers at each node signify bootstrap values, and only bootstrap values >50% are shown.

