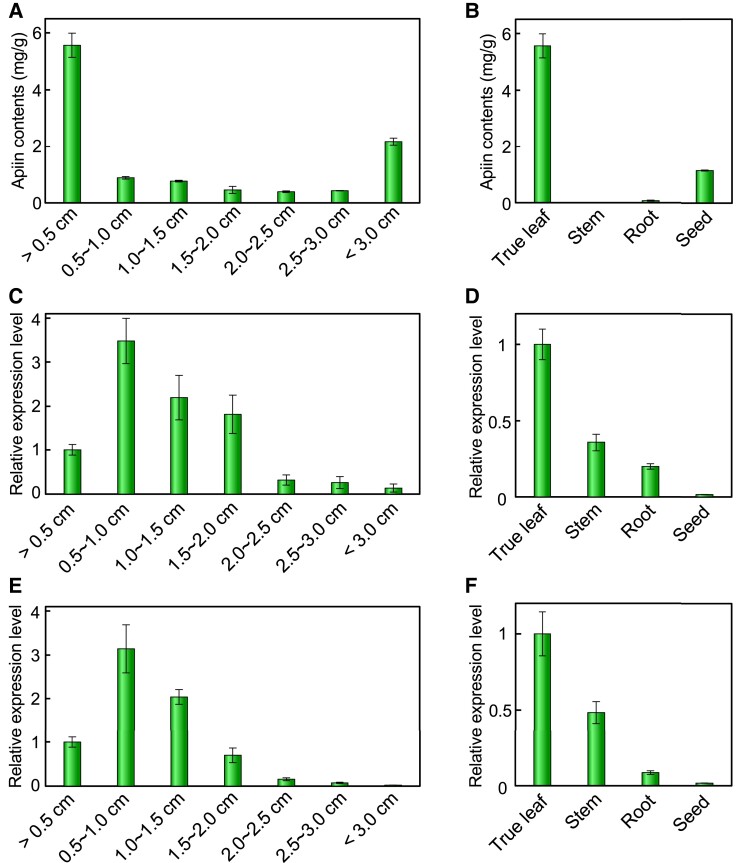
Figure 2.
Apiin contents and expression of AgApiT (UGT94AX1) in leaf developmental stages and some tissues. Apiin contents A, B) and RT-qPCR analysis of AgApiT (UGT94AX1) C, D) and AgFNSIE, F) of celery true leaf developmental stages A, C, E) and some tissues B, D, F). Apiin contents (mg) are shown per gram of each celery sample. The values on horizontal axis in A), C), and E) indicate the longitudinal length of true leaf. Each bar represents mean values and Sd from 3 biological replicates.

