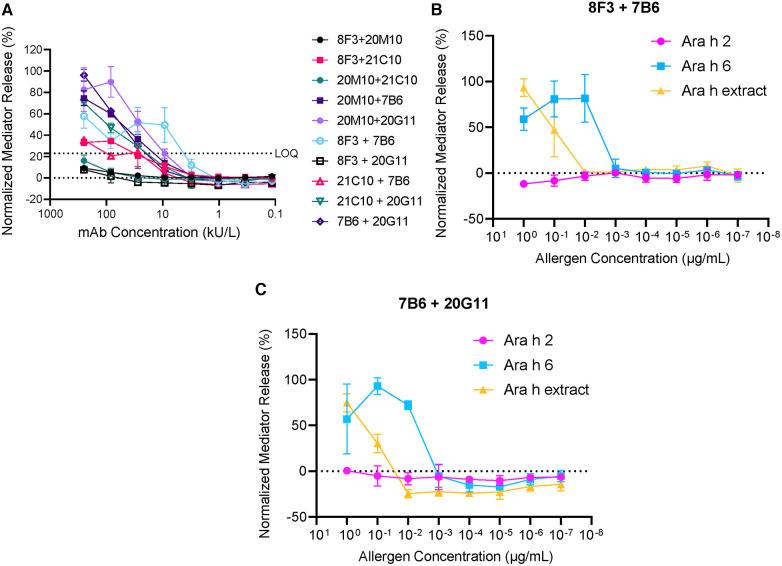
Figure 5.
Mediator release induced by hIgE mAb to Ara h 6. (A) Dose–response curves using 10 different combinations of hIgE mAb. (B) Comparison of mediator release using Ara h 6, Ara h 2, and Ara h extract (8F3 and 7B6). (C) Comparison of mediator release using Ara h 6, Ara h 2, and Ara h extract (7B6 and 20G11). LOQ, limit of quantification.

