Figure 2.
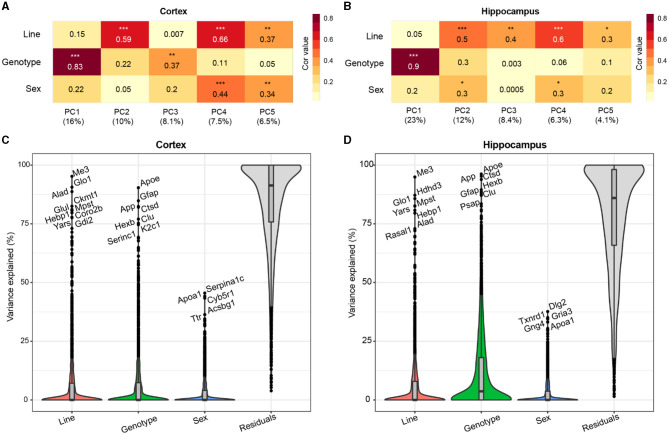
Genetic background and AD genotype strongly contribute to proteomic variance. (A, B) Principal component analysis (PCA) in the cortex (A) and hippocampus (B) was used to examine the relationship between the top five PCs and line, AD genotype, and sex traits using Spearman's rho correlation. Heatmaps represent the strength of correlation between traits and PCs (darker color indicates increasing strength of correlation). AD genotype was the most strongly associated trait with PC1 in the cortex (ρ = 0.83) and hippocampus (ρ = 0.9). P * <0.05, ** <0.01, *** <0.001. (C, D) Variance partition analysis was performed for the cortex (C) and hippocampus (D) to quantify the overall variance explained by each trait. Line and AD genotypes contributed to the highest percent variance explainable in both brain regions.

