
Figure 2.
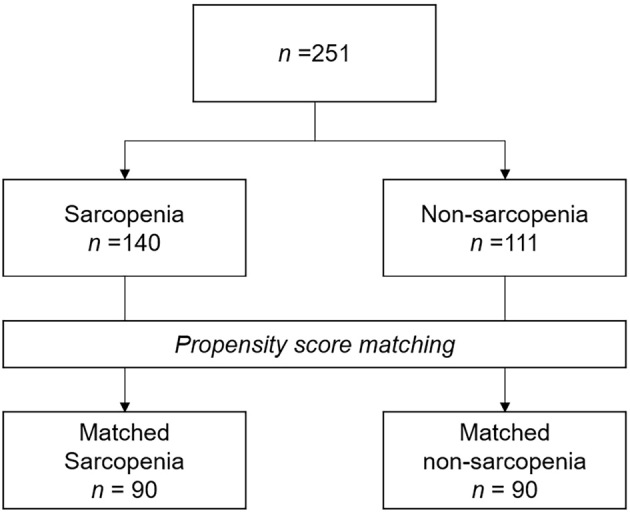
Study flow chart. Propensity score (PS) matching was performed to mitigate selection bias resulting from different patient characteristics. PSs were estimated using the characteristics of patients with and without sarcopenia as predictors in the logistic regression model for sarcopenia or non-sarcopenia; based on the PSs, 90 of 140 and 90 of 111 patients were assigned to the sarcopenia and non-sarcopenia groups, respectively.