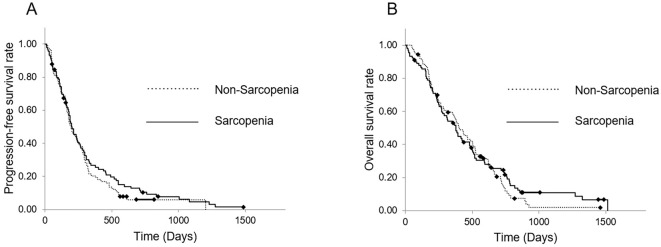
Figure 3.
Kaplan-Meier curves of the sarcopenia and non-sarcopenia groups in the PS-matched cohort. (A) The PFS from the time of first-line nab-PTX+GEM initiation. The median PFS was 200 and 194 days in the sarcopenia and non-sarcopenia groups, respectively, with no significant differences between groups (p=0.335, HR 0.858). (B) The OS from the time of first-line nab-PTX+GEM initiation. The median OS was 377 and 404 days, with no significant differences between groups (p=0.679, HR 0.908). PS: propensity score, PFS: progression-free survival, PTX: paclitaxel, GEM: gemcitabine, OS: overall survival

