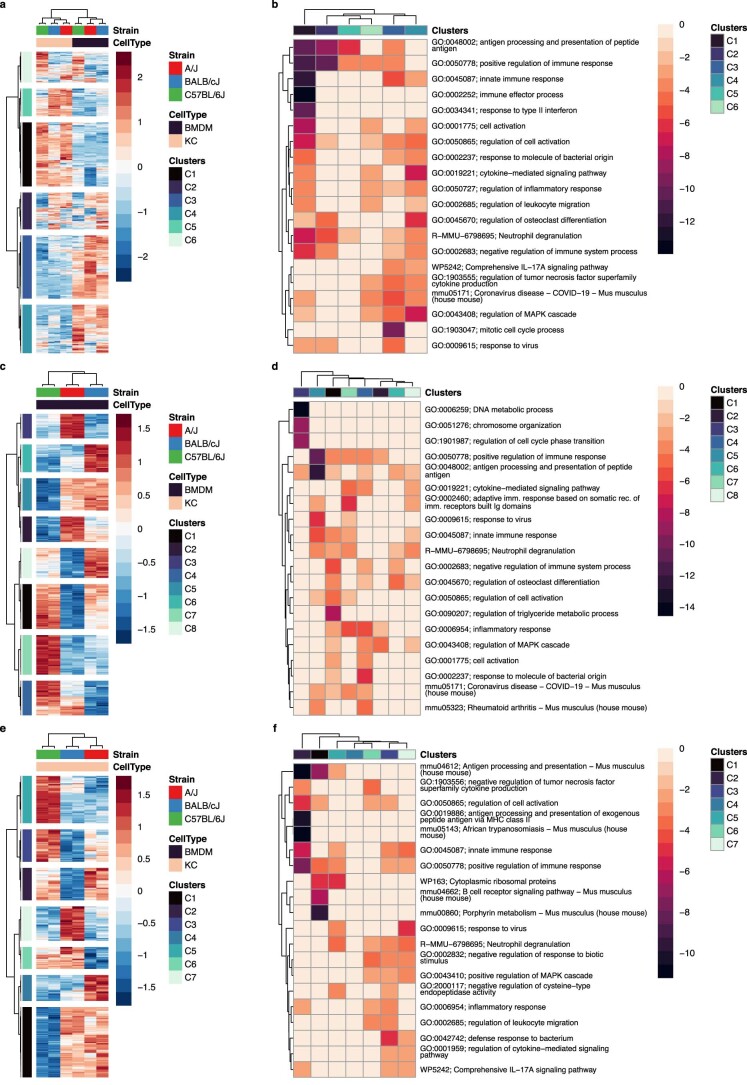
Extended Data Fig. 2. Gene-by-environment control of macrophage transcription.
a, Global comparison of differentially expressed genes between Kupffer cells or bone marrow-derived macrophages (BMDMs) of the indicated strain. Data represent the row z-score of log2(tpm + 1) values. b, Gene clusters identified in a. Data were subjected to Gene ontology analysis using Metascape. Data indicate the log10(p-value). c,e, Global comparison of strain-specific gene expression only in BMDMs, as in a. d,f, Metascape analysis of results from c and e, as assessed in b. Gene lists for individual clusters a, c and e are provided in Supplemental Table 1.

