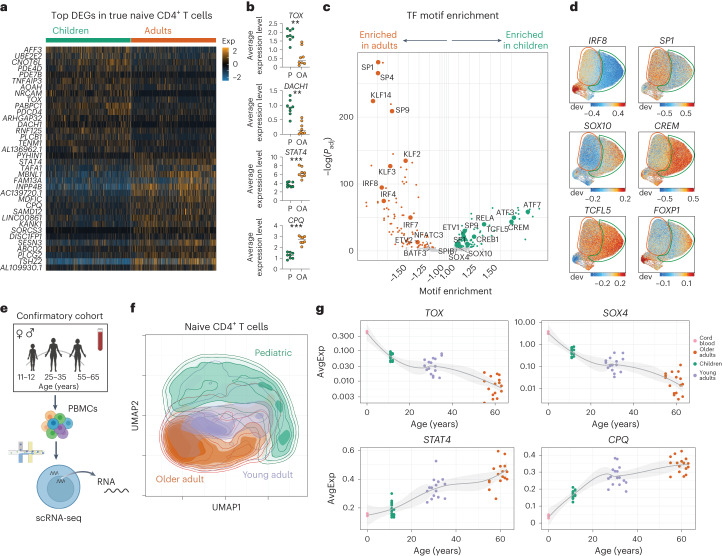
Fig. 4. Molecular reprogramming of naive CD4+ T cells across age.
a, Heat map of the top 20 DEGs for each age group in individual true naive CD4+ T cells. For visualization, values are scaled (z score) per gene. Exp, scaled expression. b, Dot plots of average pseudobulk gene expression for select transcripts in true naive CD4+ T cells separated by age (n = 8 per group; P, pediatric; OA, older adult). The line indicates the median value. P values were determined by a two-tailed Mann–Whitney test. **P = 0.0006, ***P = 0.0002. c, TF binding motif enrichment comparison between age groups in true naive CD4+ T cells. The Padj of enrichment was determined by hypergeometric testing. ETV1/ETV2, ETS translocation variant 1/2; NFATC3, nuclear factor of activated T cells, cytoplasmic 3; ATF3/ATF7, activating TF 3/7; TCFL5, TF-like 5 protein; CREM, cAMP-responsive element modulator; SPIB, Spi-B TF; SOX4/SOX10, SRY-box TF 4/10. d, ChromVar motif enrichment UMAP plots. Areas enriched for true naive CD4+ T cells in older adults (orange) and children (green) are outlined. dev, deviation. e, Overview of the scRNA-seq confirmatory cohort (n = 16 per age group). f, RNA-based UMAP plot of naive CD4+ T cells from the confirmatory cohort. g, Average pseudobulk expression of select signature genes in the naive CD4+ T cell subset for each donor across all age groups, including an external cord blood (n = 3) dataset. Best-fit lines with 95% confidence intervals are shown. AvgExp, average expression.

