Figure 2.
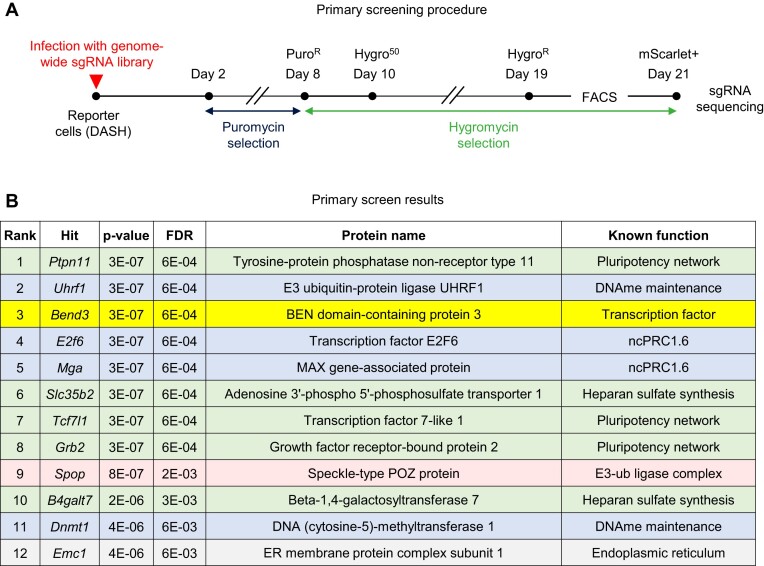
Primary screening approach and results. (A) Timeline of the genetic screen. (B) Results of the MAGeCK analysis. The top 12 hits are shown, color-coded according to class. The hits in blue were already known and were expected in the list. The hits in green influence cellular pluripotency. Pink, red and yellow: other hits.

