Figure 4.
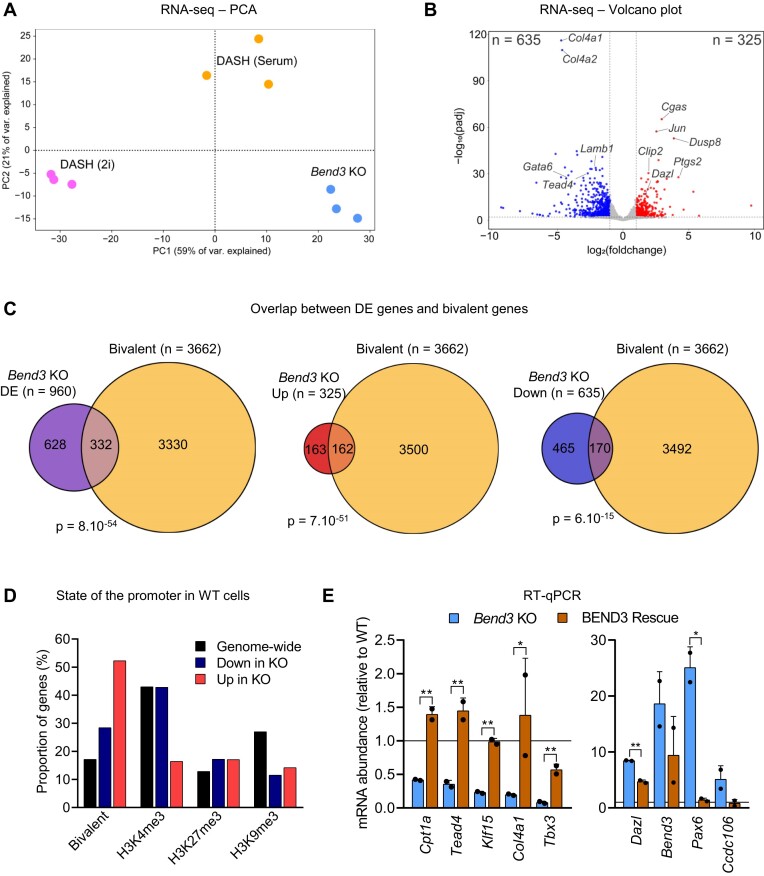
BEND3 regulates the transcription of bivalent promoters. (A) Principal Component Analysis on RNA-seq data from the indicated cells (three biological replicates for each condition). (B) Volcano plot showing genes that are downregulated (blue) or upregulated (red) in the Bend3 KO cells. (C) Venn diagrams showing the overlap between genes that are differentially expressed (DE, either up or down-regulated), upregulated, or downregulated, between Bend3 KO and WT, and genes that have a bivalent promoter (35). P-value: hypergeometric tests. (D) Proportion of genes with the indicated promoter marks within up- or down-regulated genes. (E) RT-qPCR following reintroduction of V5-BEND3 in Bend3 KO cells. Genes that were downregulated upon KO (left panel) regain expression upon rescue, while genes that were upregulated in the KO become repressed upon rescue (right panel). P-value: Student's t-test, corrected by two-stage Benjamini, Krieger, & Yekutieli FDR procedure. *P < 0.05; **P < 0.01.

