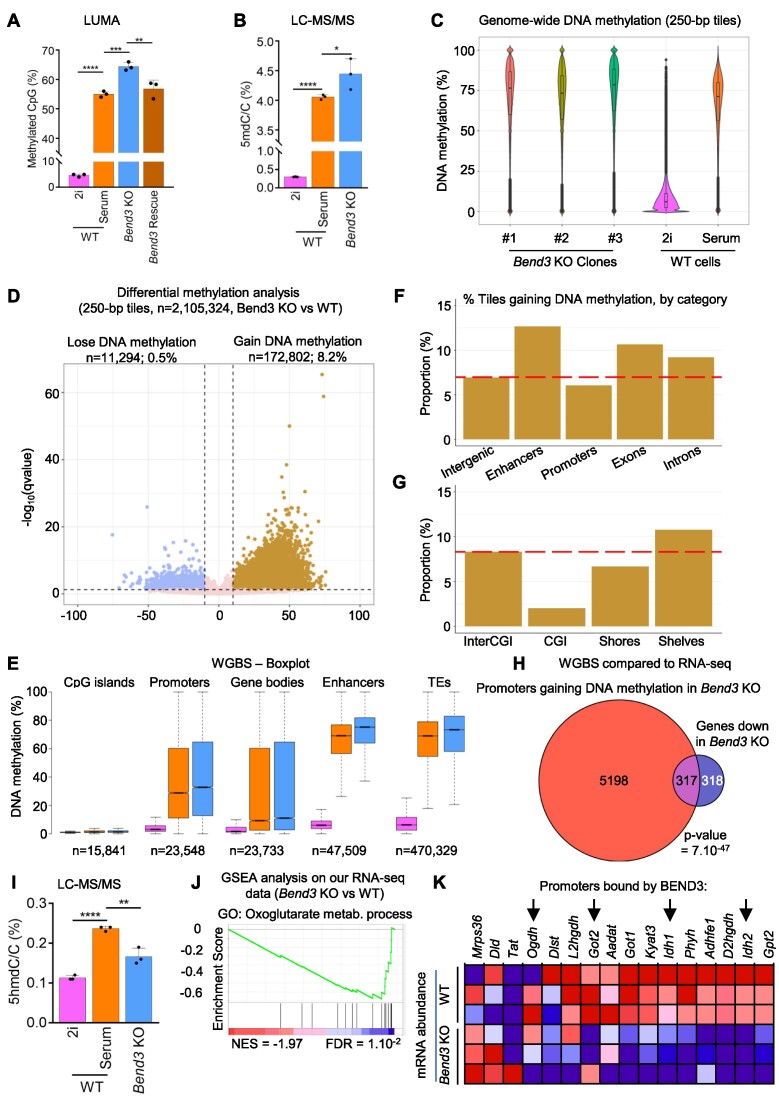
Figure 6.
Cells lacking BEND3 have increased DNA methylation and decreased DNA hydroxymethylation. (A) Evaluation by a restriction enzyme-based method (LUMA) of the global level of DNA methylation in the indicated cellular contexts. Bend3 KO cells are hypermethylated, and the expression of a BEND3 rescue construct brings DNA methylation back to WT levels. P-value: ANOVA followed by Tukey's post-hoc tests. **P< 0.01; ***P< 0.001; ****P< 0.0001. (B) Quantitation of 5-mC abundance in the cells by LC–MS/MS. P-value: ANOVA followed by Dunnett's post-hoc tests. *P< 0.05; ****P< 0.0001. (C) Distribution of methylation levels on 250-bp tiles containing 5 or more CpGs (n = 2.1 million). The three individual Bend3 KO clones are shown on the left, together with WT cells. (D) Differential methylation analysis on 250-bp tiles containing five or more CpGs (n = 2.1 million). (E) DNA methylation values for the indicated genomic elements in WT cells grown in 2i (pink) or serum (orange), and Bend3 KO cells grown in serum (blue) (F, G) Percentage of statistically significant hypermethylated tiles in the indicated genomic compartments, when comparing Bend3 KO to WT cells. The red dashed line shows the value in intergenic regions, for comparison. See Methods for details. (H) Venn diagram showing the overlap between genes that are downregulated in Bend3 KO and genes whose promoter gains DNA methylation in Bend3 KO and compared to WT. P-value: hypergeometric tests. (I) Quantitation of 5-hmC abundance in the cells by LC–MS/MS. p-value: ANOVA followed by Dunnett's post-hoc tests. **P< 0.01; ****P< 0.0001. (J) GSEA analysis on the RNA-seq data (Bend3 KO vs. WT). (K) RNA-seq data for the genes of ‘Oxoglutarate metabolic process’ GO term. Red: higher expression, blue: lower expression. The genes with promoters directly bound by BEND3 are indicated with arrows.

