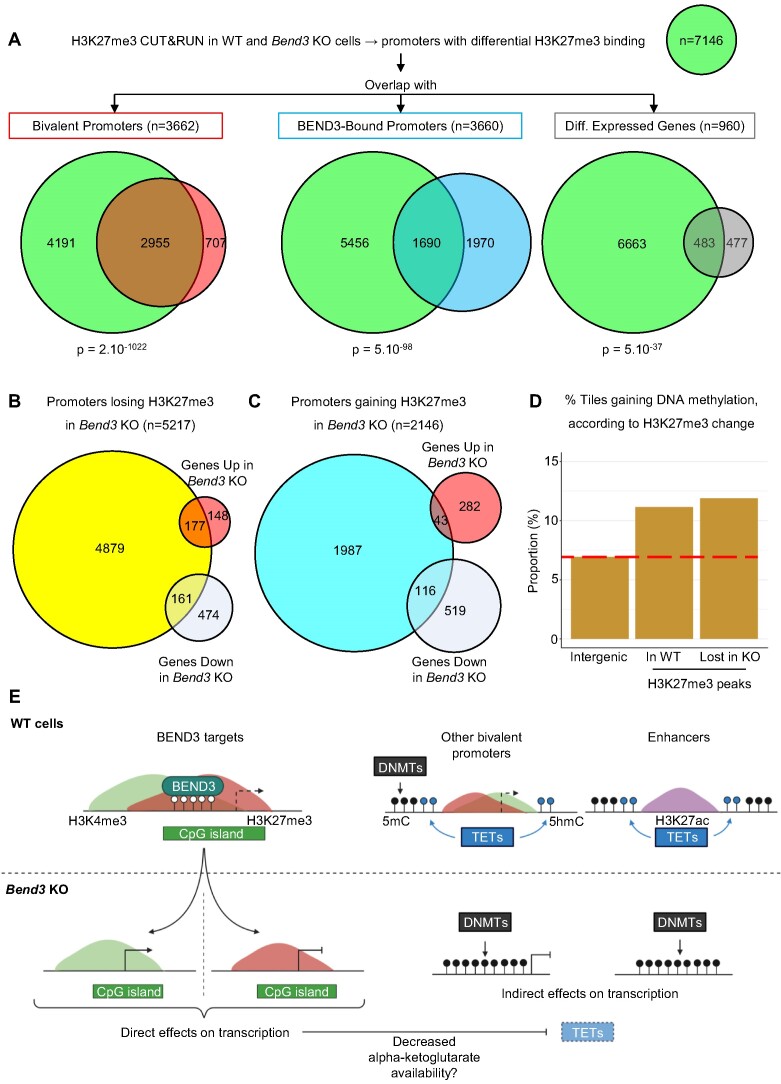
Figure 7.
Integrating the direct and indirect roles of BEND3 on chromatin and transcription. (A) Summary of the H3K27me3 CUT&RUN results in WT and Bend3 KO. P-value: hypergeometric tests. (B) Comparison of H3K27me3 loss and differential gene expression in Bend3 KO cells. (C) Comparison of H3K27me3 gain and differential gene expression in Bend3 KO cells. (D) Percentage of statistically significant hypermethylated tiles in the indicated genomic compartments, when comparing Bend3 KO to WT cells. The red dashed line shows the value in intergenic regions, for comparison. (E) Model for the direct and indirect effects of BEND3 on chromatin and gene expression.

