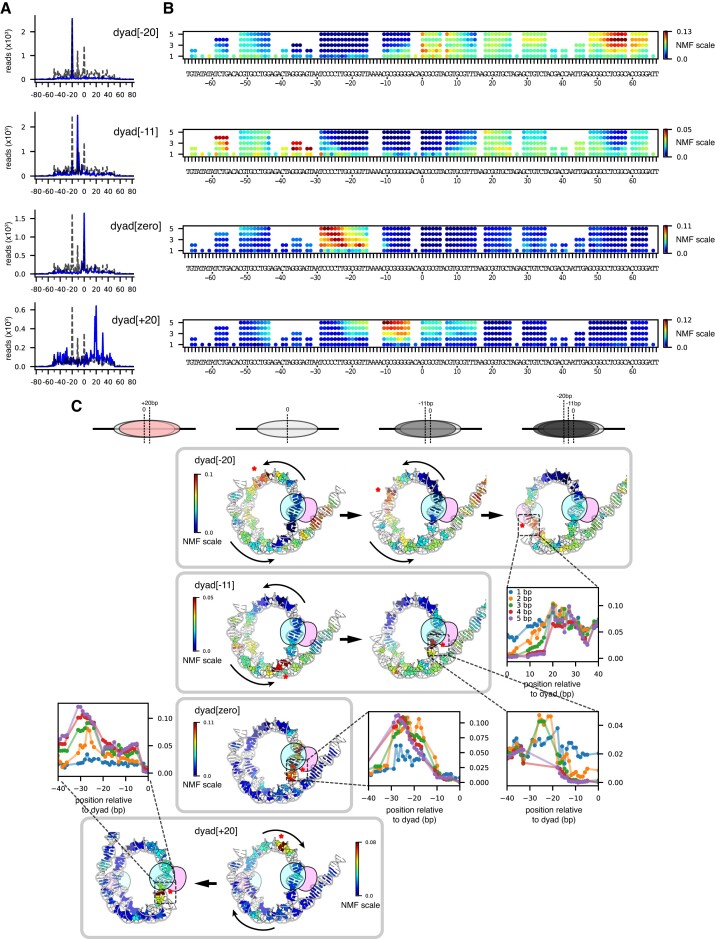
Figure 7.
Mismatches bias the distribution of nucleosome positions after sliding by Chd1. (A) Four basis dyad patterns observed after sliding by Chd1, which were used for NMF scoring (blue). The distribution of the canonical 601 is shown with dotted lines. (B) NMF scores mapped onto the Widom 601 DNA sequence based on the dyad[-20], dyad[-11], dyad[zero], and dyad[+20] patterns. (C) NMF scores for 3 bp mismatches mapped onto a Chd1-nucleosome complex (7TN2) at different translational positions, as shown in Figure 4. Asterisks highlight prevalent sites (high NMF scores), and where these sites would be repositioned after nucleosome sliding.

