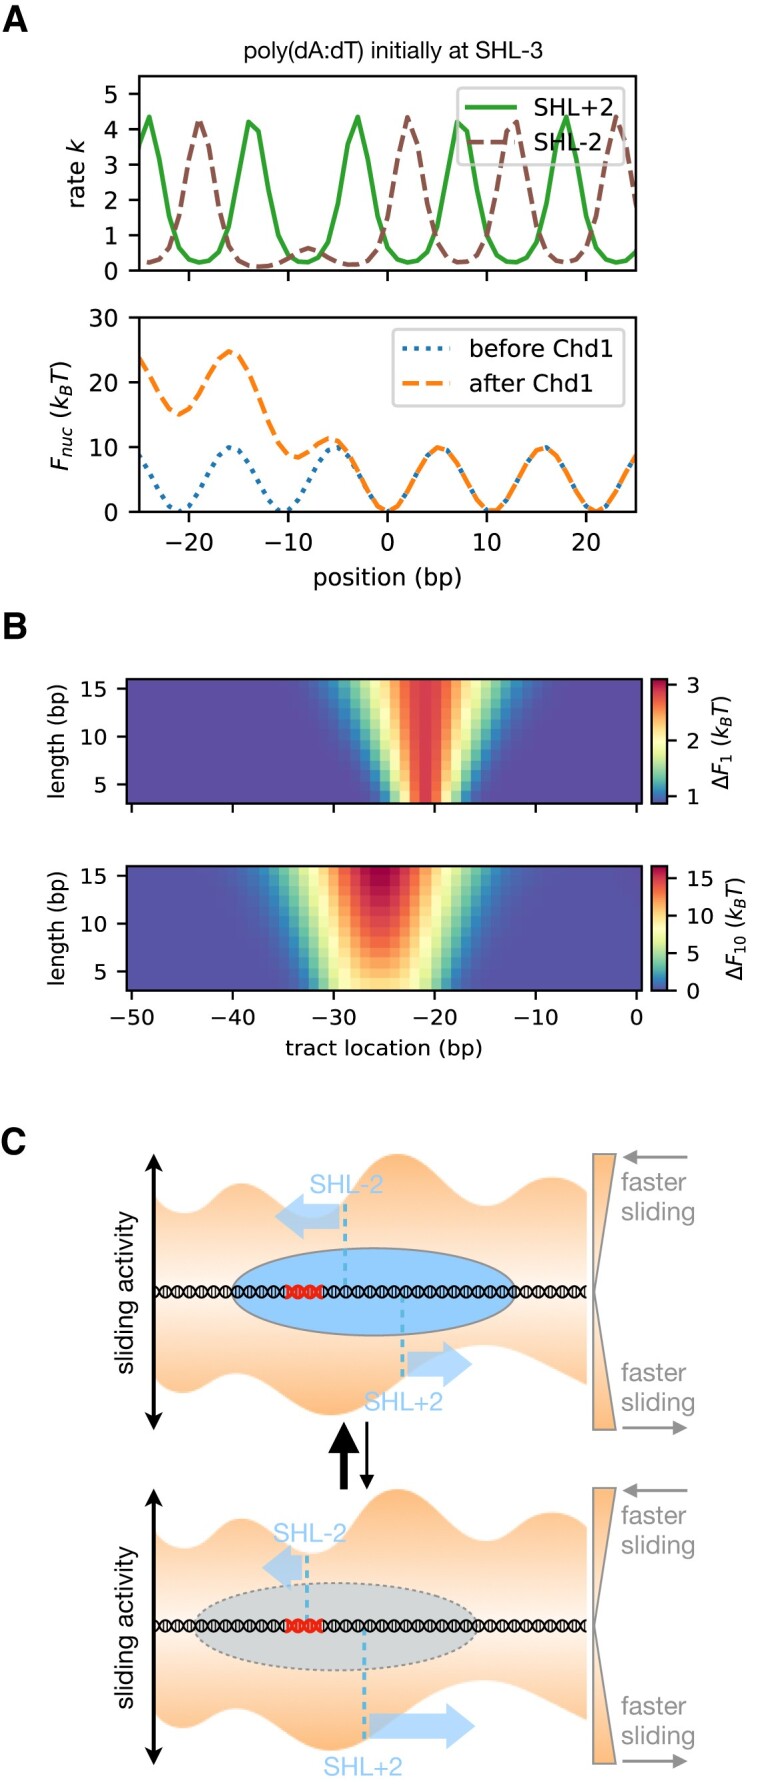
Figure 9.

A kinetic model of nucleosome remodeling by Chd1. (A) On the top, the rate of nucleosome sliding due to Chd1 binding at either SHL+2 (green, solid line) or SHL-2 (brown, dashed line) as a function of nucleosome position when a ∼10 bp poly(dA:dT) tract is initially located at −30 bp from dyad (SHL-3). On the bottom, the original 601 nucleosome free energy F(i) (dotted, blue line), and the effective nucleosome free energy after remodeling by Chd1 Feff(i) (dashed, orange line). (B) The effective free energy difference due to Chd1 remodeling by 1 bp (top) or by 10 bp (bottom) as a function of poly(dA:dT) tract initial location x (horizontal axis) and length L (vertical). The energy of sliding by 1 bp mainly takes into account the difference in the cost of defects at SHL+/-2 in the initial nucleosome configuration, whereas sliding by 10 bp takes into account this bias over the course of the entire 10 bp range. (C) Schematic model of dynamic nucleosome repositioning by Chd1, shown with nucleosome positions (ovals) overlaid on energy landscapes for forward (top) and reverse (bottom) sliding. Each SHL2 site is marked by a vertical dotted line, with the height reflecting the relative rate. Stable nucleosome positions (top) are expected where rates on both sides are similar, with the rates for sliding toward the site being faster than the rates for sliding away from it. A variety of DNA perturbations (in red) may be responsible for decreasing the rate of Chd1-driven sliding from a given side of the nucleosome, and destabilize certain nucleosome positions (bottom).
