Figure 2.
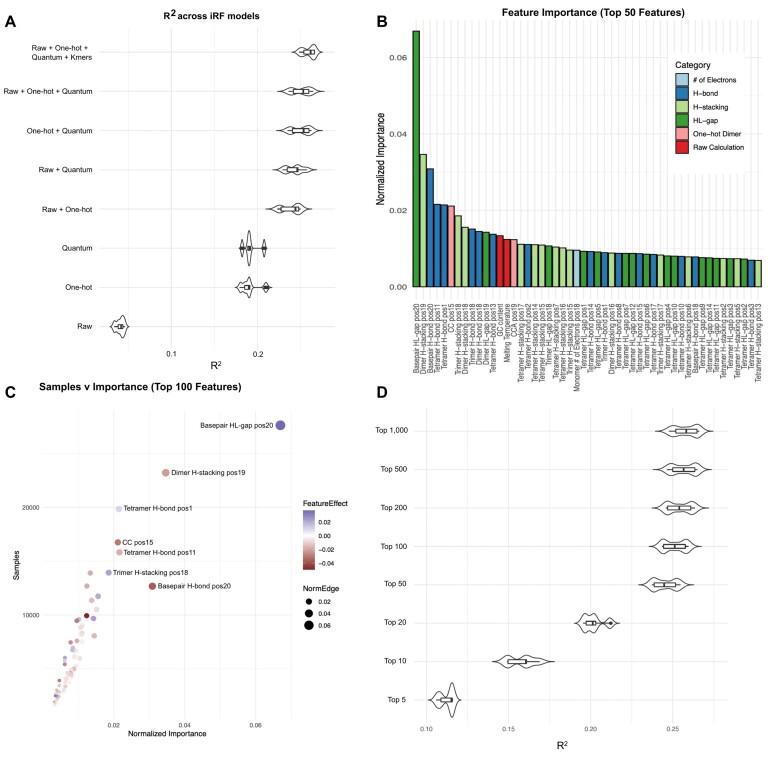
Identifying model variation based on feature input and assessing feature importance in E. coli. (A) Violin plot of R2 values based on iRF model generation with isolated feature input (feature categories described in Table 1). (B) The top 50 features from the full feature matrix iRF model ranked by normalized feature importance score and color-coded by feature category. (C) Dot plot of features from full feature matrix iRF model showing the number of samples (sgRNAs) that were influenced by that feature (y-axis) versus the normalized importance of the feature (x-axis). Color temperature increases with the feature effect score (red, negative; blue, positive) and dot size is scaled by the normalized importance score. (D) Violin plot of R2 values for the top 5, 10, 20, 50, 100, 200, 500 and 1000 features, based on full feature iRF model output. There is a plateau of information gained from including features with low importance scores.

