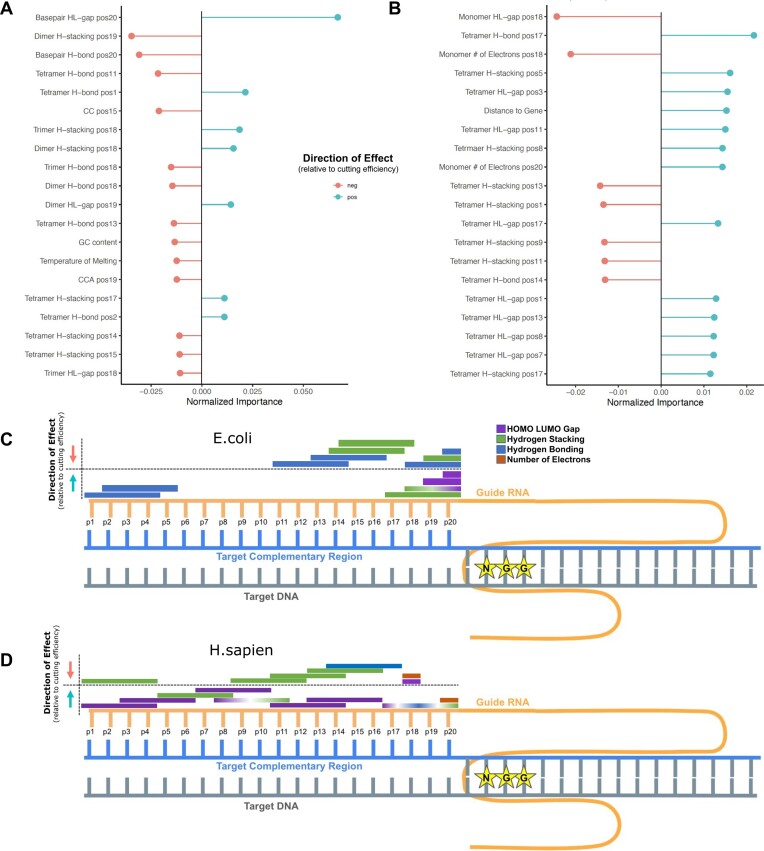
Figure 3.
Explainable-AI interpretation through iRF output metrics and features’ directional influence on cutting efficiency. (A, B) The top 20 features from the full feature matrices ranked by normalized importance score and color-coded by the direction of the effect. Positive correlations with the cutting efficiency score are blue while anti-correlations with cutting efficiency score are pink for E. coli (A) and H. sapiens (B). (C, D) sgRNA-DNA interaction highlighting quantum chemical features of top importance, their locations, and correlated associations with cutting efficiency scores in E. coli (C) and H. sapiens (D). DNA strand represented in gray (target sequence) and blue (target complementary sequence), sgRNA shown in yellow, and PAM sequence displayed with NGG stars. The feature effect direction is indicated with arrows, up (blue arrow) indicates a positively correlated relationship between the feature value and the cutting efficiency value. Feature bars indicate quantum properties (HL gap, purple; Stacking interactions, green; H-bonding, blue) and the length of the bar indicates the k-mer size. Multi-colored bars indicate the same k-mer at the same position has multiple features assessed as highly important. The E. coli (C) model shows extensive localization of important features, primarily bp, trimer and tetramers at positions 11–20. Hydrogen bonding has outlier importance at position 1–5. Hydrogen bonding and stacking energy features are observed in both correlated and anti-correlated relationships with cutting efficiency (depending on their k-mer and position) while HL-gap is consistently a positive relationship nearest the PAM sequence. The H. sapiens (D) model has lesser feature localization, with many features overlapping in positions 5–15. For features of high importance (hydrogen bonding, stacking energy, and HL-gap), the feature-specific directional effects span both positive and negative relationships with cutting efficiency, dependent on the feature length and position. Similarly to the E. coli model, bp, trimers and tetramers are the most predictive. The number of electrons H. sapiens a top feature for the H. sapiens model that is not among the top feature in E. coli.

