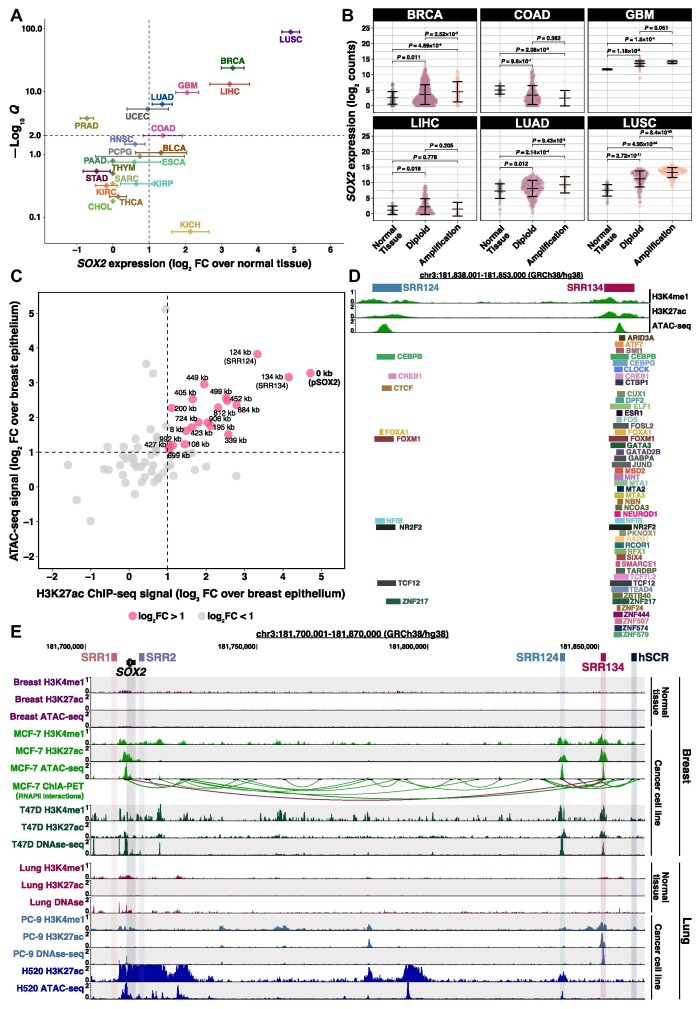
Figure 1.
A cluster 124–134 kb downstream of SOX2 gains enhancer features in cancer cells. (A) Super-logarithmic RNA-seq volcano plot of SOX2 expression from 21 cancer types compared with normal tissue (90). Cancer types with log2 FC > 1 and FDR-adjusted Q< 0.01 were considered to significantly overexpress SOX2. Error bars: standard deviation (SD). (B) SOX2 log2-normalized expression (log2 counts) associated with the SOX2 copy number from BRCA (n = 1174), COAD (n = 483), GBM (n = 155), LIHC (n = 414), LUAD (n = 552) and LUSC (n = 546) patient tumors (90). RNA-seq reads were normalized to library size using DESeq2 (88). Error bars: SD. Significance analysis by Dunn's test (180) with Holm correction (181). (C) 1500 bp genomic regions within ± 1 Mb from the SOX2 transcription start site (TSS) that gained enhancer features in MCF-7 cells (85) compared with normal breast epithelium (86). Regions that gained both ATAC-seq and H3K27ac ChIP-seq signal above our threshold (log2 FC > 1, dashed line) are highlighted in pink. Each region was labeled according to their distance in kilobases to the SOX2 promoter (pSOX2, bold). (D) ChIP-seq signal for H3K4me1 and H3K27ac, ATAC-seq signal and transcription factor ChIP-seq peaks at the SRR124–134 cluster in MCF-7 cells. Datasets are from ENCODE (85). (E) UCSC Genome Browser (102) display of H3K4me1 and H3K27ac ChIP-seq signal, DNase-seq and ATAC-seq chromatin accessibility signal, and ChIA-PET RNA polymerase II (RNAPII) interactions around the SOX2 gene within breast (normal tissue and 2 BRCA cancer cell lines) and lung (normal tissue, one LUAD and one LUSC cancer cell line) samples (85,106,108,127). Relevant RNAPII interactions (between SRR124 and SRR134, and between SRR134 and pSOX2) are highlighted in maroon.

