Figure 2.
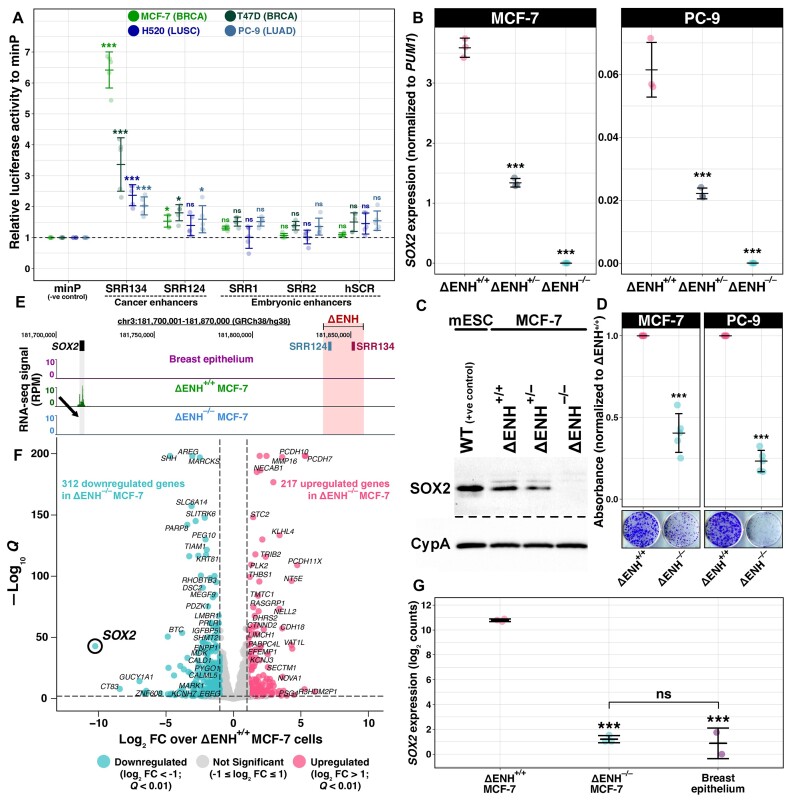
The SRR124–134 cluster drives SOX2 overexpression in BRCA and LUAD cells. (A) Enhancer reporter assay comparing luciferase activity driven by the SRR1, SRR2, SRR124, SRR134 and hSCR regions with an empty vector containing only a minimal promoter (minP). Enhancer constructs were assayed in the BRCA (MCF-7, T47D), LUAD (PC-9) and LUSC (H520) cell lines. Dashed line: average activity of minP. Error bars: SD. Significance analysis by Dunnett's test (n = 5; *P < 0.05, ***P < 0.001, ns: not significant) (182). (B) RT–qPCR analysis of SOX2 transcript levels in SRR124–134 heterozygous- (ΔENH+/–) and homozygous- (ΔENH–/–) deleted MCF-7 (BRCA) and PC-9 (LUAD) clones compared with WT (ΔENH+/+) cells. Error bars: SD. Significance analysis by Dunnett's test (n = 3; ***P < 0.001). (C) SOX2 protein levels in mouse embryonic stem cells (mESCs, positive control), ΔENH+/+, ΔENH+/– and ΔENH–/– MCF-7 clones. Cyclophilin A (CypA) was used as a loading control across all samples. (D) Colony formation assay with ΔENH+/+ and ΔENH–/– MCF-7 and PC-9 cells. Total crystal violet absorbance was normalized relative to the average absorbance from ΔENH+/+ cells for each respective cell line. Significance analysis by t-test with Holm correction (n = 5; ***P < 0.001). (E) UCSC Genome Browser (102) view of the SRR124–134 cluster deletion in ΔENH–/– MCF-7 cells with RNA-seq tracks from normal breast epithelium (86), ΔENH+/+ and ΔENH–/– MCF-7 cells. Arrow: reduction in RNA-seq signal at the SOX2 gene in ΔENH–/– MCF-7 cells. (F) Volcano plot with DESeq2 (88) differential expression analysis between ΔENH–/– and ΔENH+/+ MCF-7 cells. Blue: 312 genes that significantly lost expression (log2 FC < –1; FDR-adjusted Q < 0.01) in ΔENH–/– MCF-7 cells. Pink: 217 genes that significantly gained expression (log2 FC > 1; Q < 0.01) in ΔENH–/– MCF-7 cells. Gray: 35 891 genes that maintained similar (–1 ≤ log2 FC ≤ 1) expression between ΔENH–/– and ΔENH+/+ MCF-7 cells. (G) Comparison of SOX2 transcript levels between ΔENH+/+ and either ΔENH–/– MCF-7 or normal breast epithelium cells (86), and between ΔENH–/– MCF-7 and normal breast epithelium cells. RNA-seq reads were normalized to library size using DESeq2 (88). Error bars: SD. Significance analysis by Tukey's test (***P < 0.001, ns: not significant) (183).

