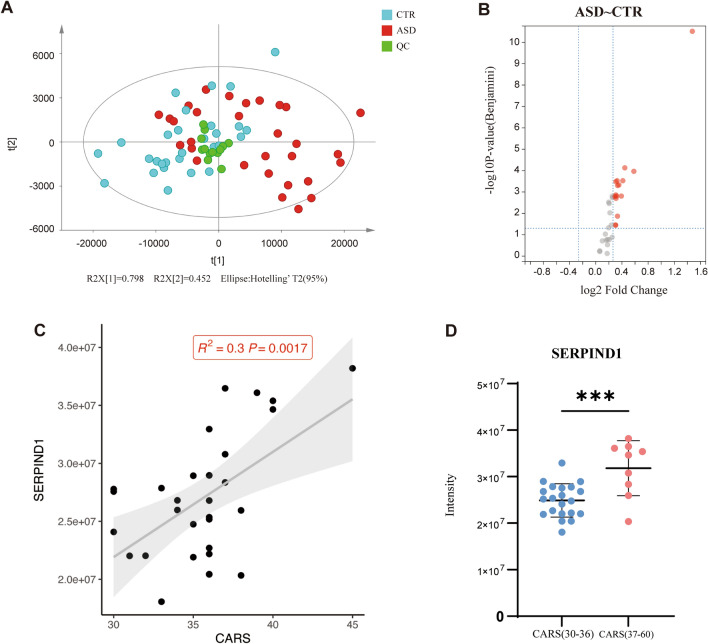
Fig. 2.
Screening of differentially-expressed proteins in the complement and coagulation pathways. A PCA analysis of complement and coagulation pathway-related proteins in plasma. B Volcano plot analysis and identification of differentially-expressed proteins. Red dots indicate P < 0.05 and fold change >1.2 (ASD vs control). C Correlation between the corresponding strength of SERPIND1 and CARS score in the ASD group. The y-axis represents the corresponding strength of the mass spectrum. D The corresponding strength of SERPIND1 between mild-moderate (30–36) and severe (37–60) ASD children. *** P <0.001.

