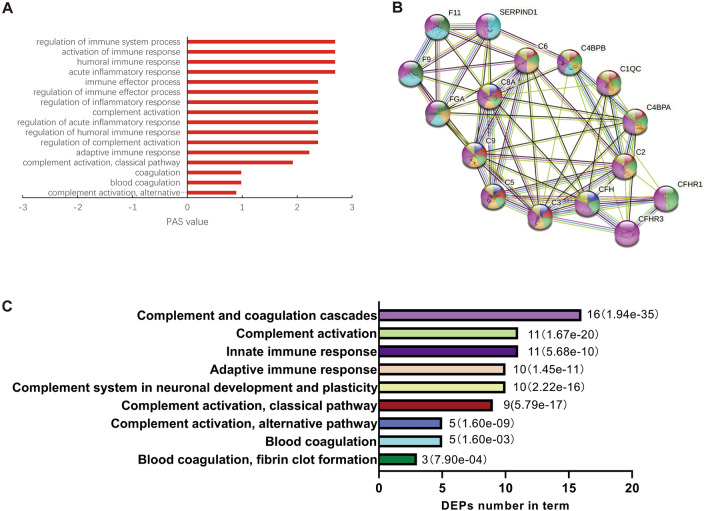
Fig. 3.
Protein-protein interaction of differentially-expressed proteins in the complement and coagulation pathway. A Based on OMICSBEAN, the PAS values of the GO-BP term in which DEPs are involved. Positive PAS values indicate the upregulation of molecular pathways compared to controls. B, C PPI was analyzed by the STRING database (GO, KEGG, and Wiki databases). The colors represent the different pathways and the number of DEPs contained in them. The P-values are represented by the bar graph.

