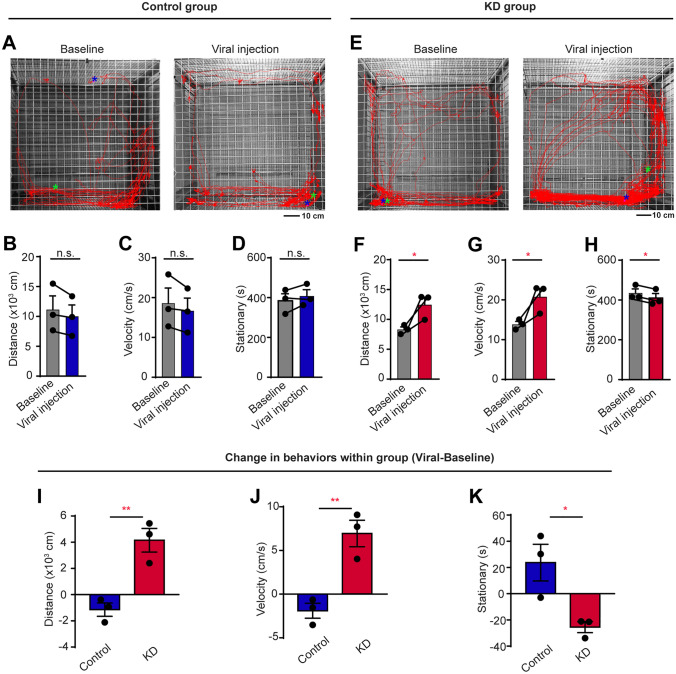
Fig. 3.
Agitated psychomotor activity in a new environment by CB1R KD marmosets. A, E Representative movement trajectories in a new environment before virus injection (left) and after virus injection (right) in a control (A) and a KD (E) marmoset. The start and end positions are indicated by green and blue asterisks, respectively. Scale bar, 10 cm. B, F Seven-day average travel distance in a new environment before and after virus injection in control (B) and KD (F) groups. n = 3, two-tailed paired t-test, t(2) = 2.227, P = 0.1558 (B); t(2) = 4.577, P = 0.0446 (F). C, G Seven-day average velocity in a new environment before and after virus injection in control (C) and KD (G) groups. n = 3, two-tailed paired t-test, t(2) = 2.227, P = 0.1558 (C); t(2) = 4.577, P = 0.0446 (G). D, H Seven-day average stationary time in a new environment before and after virus injection in control (D) and KD (H) groups. n = 3, two-tailed paired t-test, t(2) = 1.703, P = 0.2307 (D); t(2) = 6.078, P = 0.0260 (H). I–K Comparison of changes in travel distance (I), average velocity (J), and stationary time (K) in new environment between control and KD groups. n = 3 marmosets per group, two-tailed unpaired t-test, t(4) = 5.080, P = 0.0071 (I); t(4) = 5.080, P = 0.0071 (J); t(4) = 3.379, P = 0.0278 (K). *P < 0.05; **P < 0.01; n.s., not significant; data are the mean ± SEM.

